
by Melvin Halpito | Jul 21, 2026 | Article
Memahami Pixel Pitch dan Dampaknya pada Hasil Visual
Pixel pitch adalah titik awal yang paling penting saat Anda menilai layar led buatan LEDman, karena angka ini langsung memengaruhi ketajaman gambar, jarak pandang yang nyaman, dan hasil visual di ruang kerja Anda.
Jika Anda memilih terlalu rapat atau terlalu renggang tanpa melihat kebutuhan proyek, layar bisa terasa mahal di awal, tetapi tidak optimal saat dipakai harian.
Arti Pixel Pitch pada Layar LEDman
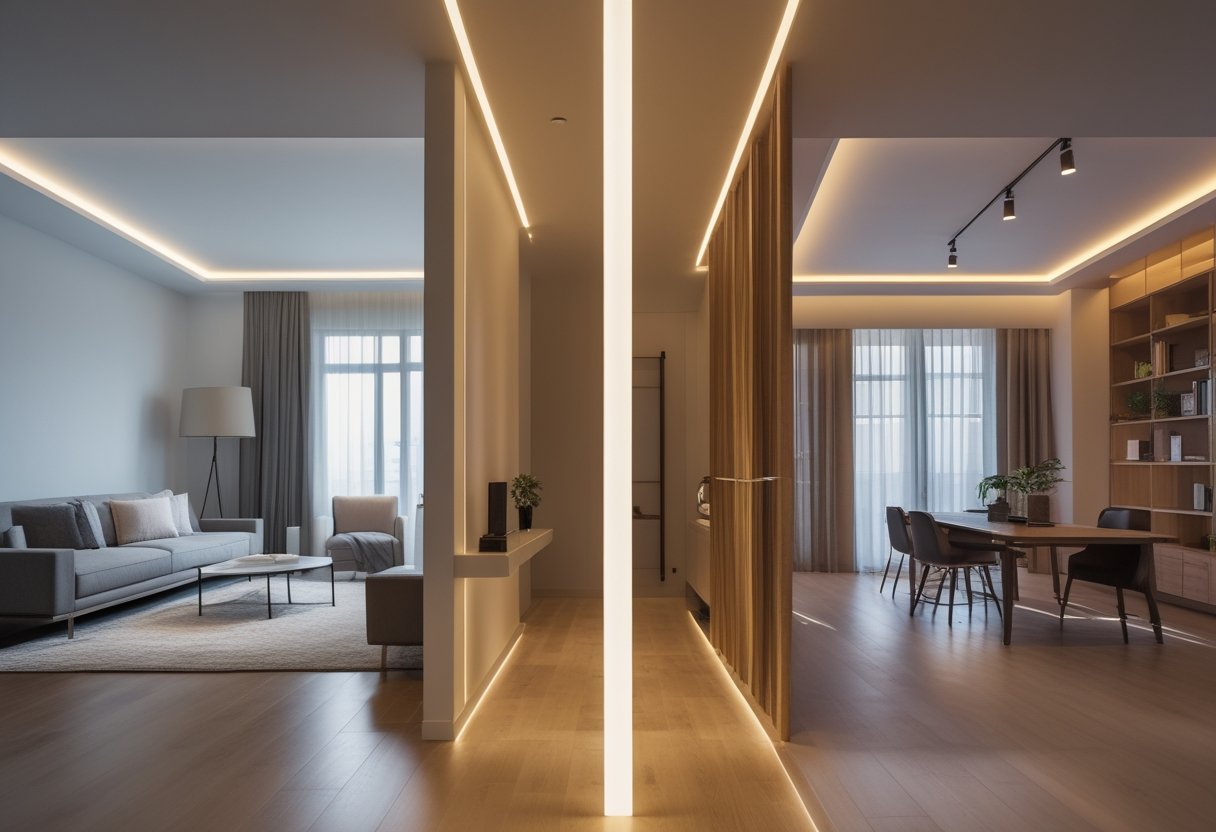
Pixel pitch adalah jarak antar titik LED, biasanya dalam milimeter. Semakin kecil angkanya, semakin rapat susunan LED dan semakin halus tampilan gambar yang Anda lihat dari dekat. Dalam proyek kantor, hal ini sangat menentukan resolusi videotron indoor agar teks presentasi dan detail grafis tetap jelas.
Hubungan Jarak Pandang dengan Kerapatan Pixel
Jarak pandang penonton menentukan seberapa kecil pixel pitch yang benar-benar Anda butuhkan. Untuk ruang meeting, jarak dekat sering menuntut pitch kecil seperti p1.2 agar gambar tidak terlihat pecah. Untuk lobby atau area komersial yang dilihat dari jarak lebih jauh, pitch seperti p3 bisa tetap memadai dan lebih efisien dari sisi anggaran.
Pengaruh Resolusi, Ketajaman, dan Ukuran Layar
Ukuran layar saja tidak menjamin hasil yang tajam. Resolusi videotron akhir terbentuk dari kombinasi ukuran fisik layar led dan pixel pitch, jadi layar besar dengan pitch yang salah bisa tetap terlihat kasar. Dalam praktik proyek, Anda perlu menyeimbangkan ketajaman, ukuran tampilan, dan posisi audiens agar hasilnya nyaman dilihat sepanjang hari.
Menentukan Spesifikasi Sesuai Kebutuhan Proyek

Spesifikasi yang tepat selalu dimulai dari fungsi ruang, bukan dari katalog produk. Anda perlu membaca pola penggunaan harian, kondisi cahaya, dan jenis konten agar layar LEDman bekerja sesuai kebutuhan nyata di lokasi.
Kebutuhan Ruang Meeting, Lobby, dan Area Komersial
Ruang meeting biasanya memerlukan pitch lebih rapat seperti p2.5 karena audiens duduk dekat layar dan sering membaca teks kecil atau angka. Lobby dan area komersial cenderung memberi jarak pandang lebih longgar, sehingga Anda bisa menimbang pitch yang lebih ekonomis tanpa mengorbankan keterbacaan. Dari pengalaman lapangan, kesalahan paling sering muncul saat kebutuhan videotron outdoor dan indoor disamakan perlakuannya. Padahal, pemasangan di luar ruangan mungkin membutuhkan pitch p4 atau p10 yang lebih sesuai dengan skala pandang publik.
Kondisi Pencahayaan dan Sudut Pandang Penonton
Cahaya ambient di ruang aktif sangat memengaruhi persepsi gambar. Berbeda dengan resolusi videotron outdoor yang membutuhkan tingkat kecerahan tinggi, layar led di dalam ruangan harus menyeimbangkan kontras agar tetap nyaman dipandang. Sudut pandang juga penting, karena penonton yang melihat dari samping tetap harus mendapat gambar yang stabil dan tidak mudah berubah warna.
Pertimbangan Konten yang Ditampilkan
Konten presentasi eksekutif, video promosi, dan dashboard operasional punya kebutuhan berbeda. Teks kecil dan data detail cenderung meminta pitch yang lebih rapat, sedangkan visual bergerak untuk branding bisa lebih fleksibel. Saat Anda sering berganti jenis konten, pilih spesifikasi yang aman untuk skenario paling menuntut, bukan yang hanya cukup untuk tampilan paling sederhana.
Menyeimbangkan Anggaran, Instalasi, dan Keandalan Jangka Panjang
Keputusan yang baik tidak berhenti pada harga pembelian. Anda juga perlu menilai kesiapan struktur, integrasi sistem, dan kemudahan perawatan supaya investasi tetap masuk akal saat dipakai jangka panjang.
Trade-Off antara Biaya Awal dan Kualitas Tampilan
Pitch yang lebih kecil hampir selalu berarti biaya lebih tinggi, karena komponen LED yang lebih rapat dan sistem yang lebih presisi. Di sisi lain, pitch yang terlalu besar bisa membuat tampilan kurang nyaman, terutama untuk ruang dekat. Anda perlu menimbang apakah tambahan biaya untuk mengejar resolusi videotron yang tinggi di awal akan terbayar oleh kenyamanan baca, citra ruang, dan umur pakai yang lebih sesuai.
Kesiapan Struktur, Integrasi Sistem, dan Perawatan
Sebelum pemasangan, struktur dinding, akses servis, jalur listrik, dan ventilasi harus dicek dengan rapi. Di kantor aktif, instalasi yang bersih dan minim gangguan sangat penting agar operasional harian tetap jalan. Integrasi dengan sistem presentasi, kontrol, dan sumber konten juga perlu direncanakan sejak awal, supaya layar tidak menjadi aset yang sulit dipakai.
Peran Konsultasi Teknis untuk Meminimalkan Salah Spesifikasi
Asesmen lokasi sering menentukan sukses atau gagalnya proyek LED. Konsultasi teknis membantu Anda membaca jarak pandang, arah cahaya, titik akses instalasi, dan kebutuhan integrasi sebelum keputusan dibekukan. Dalam proyek seperti ini, tim seperti MLV Teknologi biasanya berguna karena bisa menghubungkan kebutuhan ruang, instalasi yang rapi, dan koordinasi kerja yang tidak mengganggu aktivitas kantor.
by Melvin Halpito | Jul 20, 2026 | Article
Dasar Teknologi LEDman Yang Perlu Dipahami
Kalau Anda memilih LEDman untuk ruang kerja, keputusan paling penting bukan sekadar melihat terang atau harga, melainkan menyesuaikan teknologi panel dengan jarak pandang, tingkat aktivitas ruangan, dan kebutuhan perawatan.
Memahami perbedaan antara led smd dan led cob sangat krusial bagi pengelola gedung maupun desainer interior. Keduanya menawarkan keunggulan unik dalam ekosistem layar led modern saat ini.
Cara Kerja Panel SMD Dan COB
SMD atau surface mounted device memakai dioda merah, hijau, dan biru yang dipasang di permukaan PCB. Struktur ini membuat panel lebih fleksibel untuk produksi dan lebih mudah dirawat. Sementara itu, chip on board atau COB menanam chip LED langsung ke papan lalu menutupnya dengan resin.
Dalam praktik AV, perbedaan cara kerja ini langsung terasa saat instalasi dan penggunaan harian. SMD cocok saat Anda butuh sistem yang matang, mudah diservis, dan tersedia luas. COB lebih kuat saat Anda mengejar permukaan yang halus, perlindungan fisik lebih baik, dan tampilan dekat yang lebih nyaman.
Perbedaan Tampilan, Ketahanan, Dan Kerapatan Piksel
Smd led cenderung memberi titik cahaya yang lebih jelas, terutama jika Anda berdiri terlalu dekat. Pada pixel pitch yang lebih besar, visualnya tetap tajam untuk jarak menengah. Sedangkan cob led memberi tampilan yang lebih rata dan lembut, sehingga lebih enak dilihat dari dekat.
Dari sisi ketahanan, COB biasanya lebih siap untuk area dengan risiko sentuh, benturan ringan, atau paparan debu yang lebih tinggi. Kerapatan piksel yang rapat juga lebih sering diasosiasikan dengan COB untuk indoor premium. SMD tetap unggul saat Anda butuh biaya yang lebih efisien dan perbaikan lapangan yang sederhana. Teknologi terbaru bahkan mulai memperkenalkan micro led yang menawarkan kontras jauh lebih tinggi untuk kebutuhan visual ekstrem.
Dampak Teknologi Terhadap Pengalaman Visual Pengguna
Pengguna akhir sering tidak menyebut istilah teknis, tetapi mereka langsung merasakan pantulan, ketajaman, dan kenyamanan mata. COB biasanya terasa lebih tenang untuk ruang yang dipakai lama, seperti ruang kontrol atau boardroom, karena permukaannya lebih halus dan seragam. SMD lebih cocok saat Anda mengejar visibilitas kuat dari berbagai sudut dan jarak yang tidak terlalu dekat.
Jika ruang Anda sering dipakai untuk presentasi, meeting, dan video conference, pengalaman visual yang stabil sering lebih penting daripada sekadar spesifikasi di atas kertas. Di titik ini, konsultasi teknis dari tim seperti MLV Teknologi membantu Anda menilai apakah ruang Anda lebih cocok ke SMD atau COB berdasarkan pola pakai nyata, bukan asumsi umum.
Faktor Penentu Pemilihan Berdasarkan Kondisi Ruang
Pilihan yang tepat hampir selalu ditentukan oleh konteks ruang, bukan oleh teknologi yang paling baru. Jarak pandang, cahaya ruangan, dan tingkat risiko fisik akan mengubah hasil akhir secara nyata.
Jarak Pandang Dan Ukuran Area Tampilan
Untuk ruang besar dengan jarak pandang menengah hingga jauh, SMD sering lebih masuk akal karena efisien dan cukup aman secara visual. Saat Anda duduk dekat layar led, terutama di ruang meeting kecil, COB memberi pengalaman yang lebih halus. Semakin rapat pitch yang dibutuhkan, semakin penting Anda mengecek apakah tampilan akan dilihat dari 1–3 meter atau dari 5 meter ke atas.
Ukuran area tampilan juga berpengaruh pada biaya total. Panel besar dengan resolusi tinggi membuat perbedaan biaya antara SMD dan videotron cob menjadi terasa. Pemetaan jarak duduk paling dekat sering lebih berguna daripada sekadar membandingkan spesifikasi panel.
Pencahayaan Ruangan Dan Kontrol Pantulan
Ruangan dengan banyak cahaya alami atau lampu plafon yang kuat perlu perhatian khusus pada pantulan dan kontras. COB lebih nyaman saat Anda ingin permukaan terlihat lebih rata dan tidak terlalu kasar di mata. SMD masih aman dipakai, selama posisi layar, sudut pandang, dan kontrol cahaya ruangan diatur dengan benar.
Pada lobby dan area publik indoor, Anda biasanya tidak mengontrol semua kondisi cahaya. Maka, pemilihan finish layar, tingkat kecerahan, dan penempatan menjadi sama pentingnya dengan jenis panel. Banyak proyek gagal bukan karena teknologinya salah, melainkan karena pantulan dan pencahayaan ruangan diabaikan sejak awal.
Risiko Sentuhan, Debu, Dan Intensitas Pemakaian
Jika layar ditempatkan di area dengan lalu lintas tinggi, risiko sentuhan dan debu tidak bisa dianggap kecil. COB punya keunggulan saat panel sering terpapar aktivitas fisik ringan atau dibersihkan lebih sering. SMD tetap relevan, tetapi Anda perlu lebih disiplin pada proteksi fisik dan akses maintenance.
Intensitas pemakaian juga menentukan umur layanan yang Anda rasakan. Ruang yang hidup 12–24 jam per hari menuntut kestabilan termal dan rencana servis yang jelas. Untuk ruang aktif seperti ini, solusi instalasi yang rapi dan minim gangguan operasional sering lebih bernilai daripada sekadar memilih panel yang paling mahal.
Panduan Rekomendasi Untuk Lingkungan Komersial
Rekomendasi yang paling aman datang dari cara pakai ruang, bukan dari label teknologi. Pada lingkungan komersial, kebutuhan visual, operasional, dan perawatan harus dibaca sebagai satu paket.
Ruang Meeting Dan Boardroom
Untuk ruang meeting dan boardroom, COB sering lebih unggul jika peserta duduk dekat layar dan presentasi berlangsung lama. Tampilan yang lebih halus membantu saat Anda membaca teks, grafik, atau tampilan video conference. Jika ruangnya kecil dan pencahayaan sulit dikendalikan, COB memberi margin kenyamanan yang lebih baik.
SMD tetap tepat jika boardroom Anda lebih besar, jarak pandangnya menengah, dan anggaran perlu dijaga. Dalam proyek kantor yang aktif, instalasi yang tidak mengganggu pekerjaan harian juga penting. Di sinilah pendekatan konsultasi dan eksekusi yang rapi, seperti yang biasa dikerjakan MLV Teknologi, membantu Anda menyeimbangkan kualitas tampilan dan kelancaran operasional.
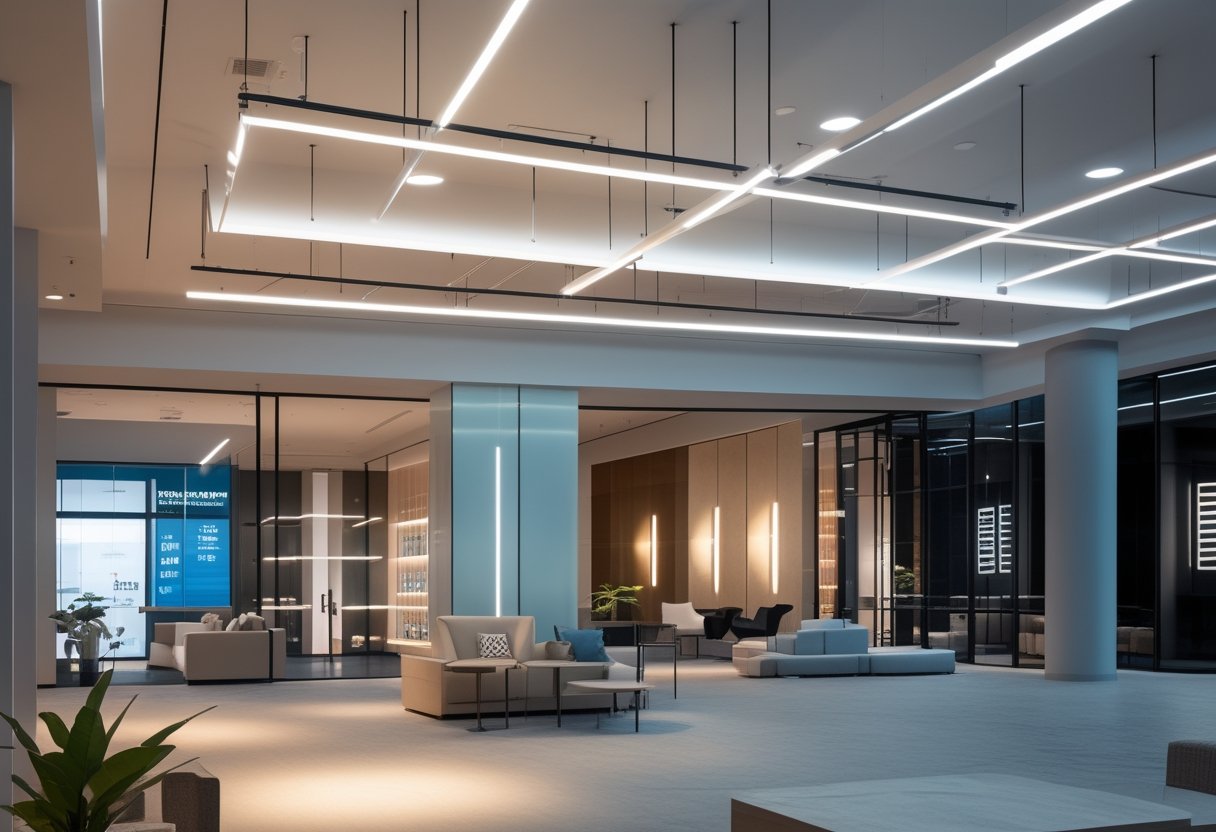
Lobby, Retail, Dan Area Publik Indoor
Untuk lobby dan retail, SMD sering dipilih karena fleksibel, terang, dan cocok untuk menarik perhatian dari jarak lebih jauh. Saat area cukup luas dan konten visual berubah-ubah, SMD memberi hasil yang praktis dan ekonomis. COB lebih pas jika Anda ingin tampilan premium di area resepsionis atau display yang dilihat dekat.
Di area publik indoor, daya tahan fisik dan kemudahan servis perlu masuk ke daftar prioritas. Layar yang mudah diakses teknisi dan tidak merepotkan saat perawatan harian biasanya lebih bernilai daripada spesifikasi yang hanya bagus di brosur. Pemilik bisnis sering lebih untung saat desain sistem mempertimbangkan downtime sesedikit mungkin.
Command Center Dan Ruang Operasional Kritis
Command center menuntut konsistensi tampilan, kenyamanan mata, dan stabilitas jangka panjang. COB biasanya lebih kuat untuk skenario ini karena gambar terasa lebih halus dan nyaman saat dipantau terus-menerus. Untuk ruang yang dipakai operator dalam shift panjang, perbedaan kecil pada kejernihan visual bisa berdampak pada fokus kerja.
SMD masih bisa menjadi pilihan jika ruangnya lebih besar, pantauan dilakukan dari jarak tertentu, dan efisiensi biaya tetap menjadi target utama. Yang paling penting adalah integrasi sistem, akses servis, dan pemasangan yang tidak mengganggu operasional. Untuk ruang kritis seperti ini, Anda sebaiknya menilai teknologi bersama tim AV yang paham konteks kerja lapangan, bukan hanya mengejar spesifikasi teknis tertinggi.
by Melvin Halpito | Jul 19, 2026 | Article
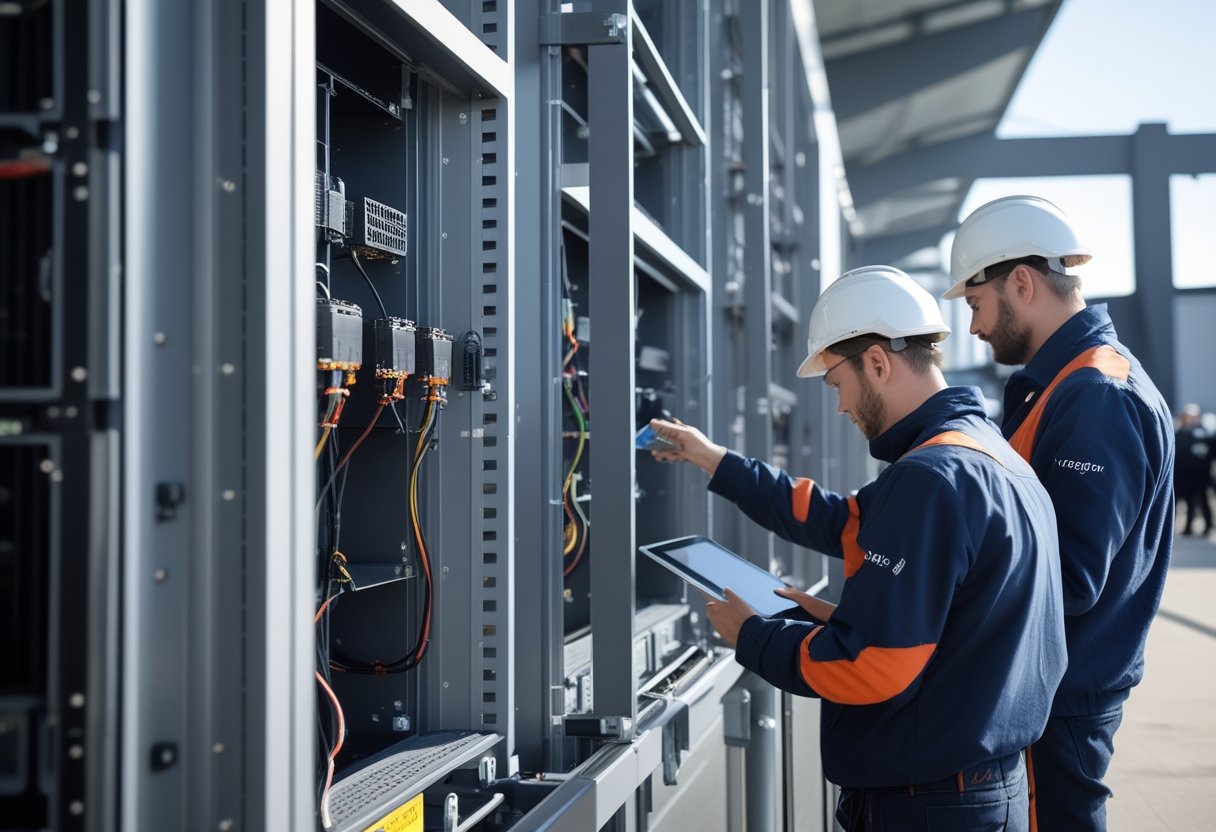
Persiapan Teknis Sebelum Pemasangan
Standar instalasi LEDman Videotron yang stabil selalu dimulai dari perencanaan teknis yang rapi. Proses pemasangan videotron yang profesional menjamin ketahanan perangkat dalam berbagai kondisi lingkungan. Kalau analisis lokasi, spesifikasi panel, dan koordinasi operasional sejak awal sudah benar, Anda akan lebih mudah menjaga tampilan yang konsisten, aman, dan gampang dirawat dalam jangka panjang.
Analisis Lokasi Dan Kebutuhan Tampilan
Langkah pertama adalah membaca ruang secara nyata, bukan hanya melihat gambar layout. Anda perlu tahu jarak pandang, arah cahaya ruangan, posisi ceiling, titik listrik, dan jalur akses teknisi. Kebutuhan untuk videotron indoor tentu berbeda dengan layar yang ditempatkan di luar ruangan yang terpapar cuaca langsung. Untuk ruang meeting, lobi, atau area komersial aktif, hal kecil seperti pantulan cahaya dan posisi pintu servis bisa sangat memengaruhi hasil akhir.
Di proyek yang saya lihat berjalan lancar, tim selalu menilai apakah layar akan dipakai untuk presentasi, signage, atau konten dinamis. Kebutuhan itu menentukan ukuran layar, tingkat kecerahan, dan cara instalasi agar tidak mengganggu interior serta aktivitas harian.
Penentuan Spesifikasi Modul, Resolusi, Dan Pitch
Spesifikasi modul harus mengikuti fungsi ruang, bukan sekadar mengejar angka resolusi tinggi. Untuk videotron indoor, pixel pitch yang terlalu rapat tanpa kebutuhan nyata bisa membuat biaya membesar tanpa manfaat yang sebanding. Selain kerapatan pixel, perhatikan juga refresh rate agar tampilan visual tetap halus dan tidak berkedip saat direkam kamera. Yang lebih penting adalah keseimbangan antara ukuran layar, jarak baca, dan kualitas visual pada konten yang paling sering dipakai.
Dalam evaluasi vendor, Anda sebaiknya minta simulasi resolusi dan tampilan dari jarak pakai sebenarnya. Dari pengalaman lapangan, pitch yang tepat sering terasa lebih penting daripada panel yang “mahal” di atas kertas, karena hasil akhirnya harus nyaman dilihat dan tidak melelahkan mata.
Koordinasi AV Dengan Interior Dan Operasional Gedung
Instalasi videotron yang baik selalu masuk ke rencana interior dan operasional gedung. Anda perlu memastikan struktur mounting tidak merusak finishing, jalur kabel tidak mengganggu estetika, dan akses maintenance tetap mudah dibuka tanpa bongkar besar. Di ruang kerja aktif, penjadwalan kerja malam atau bertahap sering lebih aman agar aktivitas harian tidak terganggu.
MLV Teknologi, misalnya, dikenal menangani konsultasi dan implementasi dengan pendekatan yang rapi serta responsif, sehingga pekerjaan AV bisa selaras dengan kondisi gedung yang tetap beroperasi. Untuk Anda yang sedang menilai vendor, pendekatan seperti ini penting karena hasil akhir bukan hanya layar menyala, melainkan sistem yang tertib dan mudah dikelola.
Standar Struktur Dan Sistem Daya
Kekuatan struktur rangka videotron dan kualitas daya adalah dua fondasi yang paling sering menentukan umur pakai videotron. Tanpa konstruksi videotron yang kokoh, risiko deformasi atau kegagalan mekanis dapat meningkat seiring waktu. Jika rangka kurang presisi atau distribusi listrik tidak stabil, masalah kecil akan muncul sebagai getaran, panel tidak rata, panas berlebih, atau gangguan tampilan.
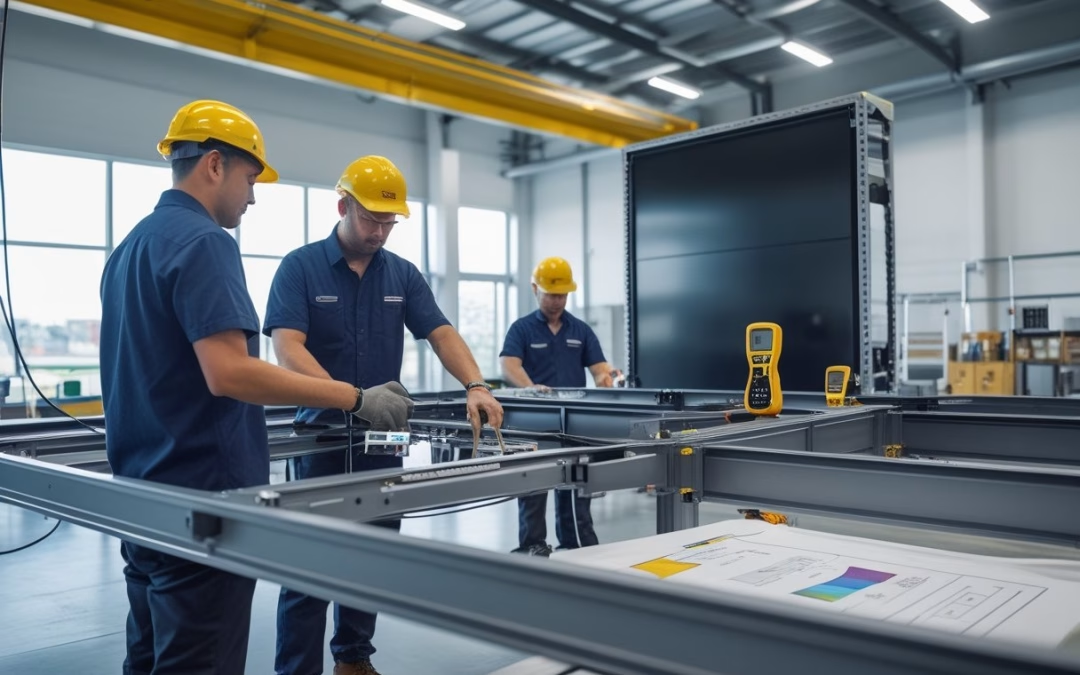
Rancangan Rangka, Beban, Dan Titik Penopang
Rangka mounting harus dihitung berdasarkan bobot total panel, akses servis, dan kondisi dinding atau lantai penopang. Dalam proyek videotron indoor, beban ke struktur gedung sering perlu dicek lebih detail karena sistem harus menyatu dengan interior. Berbeda dengan videotron outdoor yang membutuhkan perhitungan beban angin, fokus di dalam ruangan adalah pada keamanan struktur penopang utama. Titik penopang yang salah bisa membuat panel sulit rata dan menyulitkan kalibrasi akhir.
Saya biasanya melihat vendor yang baik dari cara mereka menjelaskan distribusi beban, titik anchor, dan toleransi level permukaan. Kalau penjelasannya jelas sejak awal, peluang masalah saat instalasi turun jauh.
Distribusi Listrik, Proteksi, Dan Grounding
Distribusi daya harus dibagi dengan rapi agar setiap kabinet menerima suplai yang stabil. Anda perlu memastikan ada proteksi arus, pemutus yang tepat, serta grounding yang benar untuk mengurangi risiko lonjakan dan gangguan perangkat. Pada lingkungan kantor, kesiapan panel listrik dan jalur dedicated sering menjadi penentu apakah videotron bisa berjalan mulus setiap hari.
UPS atau stabilizer bisa relevan tergantung beban dan sensitivitas sistem. Untuk ruang komersial yang tidak boleh sering mati, proteksi listrik yang baik memberi lapisan keamanan tambahan dan mengurangi risiko downtime.
Manajemen Kabel, Ventilasi, Dan Akses Perawatan
Kerapian kabel bukan hanya soal estetika, melainkan juga soal keandalan dan servis. Kabel data dan daya yang ditata jelas akan memudahkan troubleshooting saat ada modul yang perlu dicek. Di banyak proyek indoor, kabel yang berantakan justru membuat servis lama dan meningkatkan risiko salah cabut.
Ventilasi juga harus cukup agar panas tidak terjebak di belakang panel. Anda perlu memastikan ada ruang servis dan akses pembukaan yang masuk akal, supaya teknisi bisa bekerja cepat tanpa mengganggu area kerja atau finishing interior. Standar yang baik selalu mempertimbangkan maintenance videotron sejak hari pertama, bukan setelah masalah muncul. Akses yang memadai memudahkan tim teknis melakukan pembersihan berkala dan penggantian suku cadang.
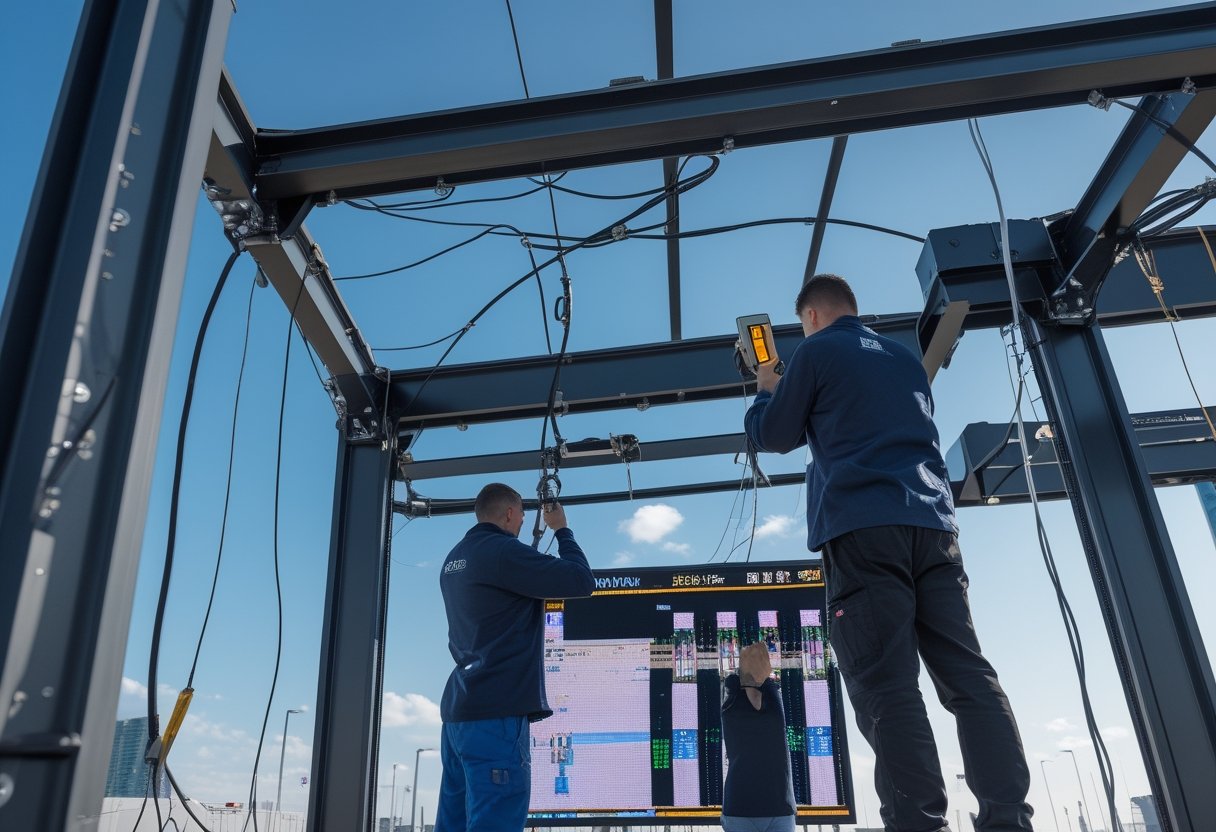
Commissioning, Kalibrasi, Dan Serah Terima
Tahap commissioning menentukan apakah instalasi sudah siap dipakai secara operasional. Pada tahap ini, sistem diuji sebagai satu kesatuan: kontroler, sinyal, daya, warna, kecerahan, dan konsistensi antarpanel.
Pengaturan Kontroler Dan Sinkronisasi Sinyal
Kontroler harus disetel sesuai layout panel dan sumber input yang dipakai di ruang Anda. Sinkronisasi sinyal perlu diuji dari perangkat utama, termasuk laptop presentasi, media player, atau sistem kontrol ruang jika ada. Kalau konfigurasi awal tidak tepat, gejala yang muncul biasanya berupa gambar terpotong, delay, atau tampilan tidak sesuai rasio.
Pada proyek yang rapi, teknisi akan mengecek input dan output satu per satu sebelum serah terima. Pendekatan ini mengurangi risiko komplain setelah ruangan dipakai normal.
Kalibrasi Kecerahan, Warna, Dan Keseragaman Panel
Kalibrasi harus dilakukan untuk menjaga brightness uniformity dan warna yang seragam di seluruh permukaan layar. Panel yang tampak sama di siang hari belum tentu konsisten saat ruangan redup, jadi pengujian perlu dilakukan dalam beberapa kondisi tampilan. Kecerahan yang terlalu tinggi juga bisa mengganggu kenyamanan mata di ruang meeting atau lobby indoor. Pastikan juga pengaturan refresh rate sudah optimal agar tidak terjadi moiré effect atau flicker saat layar difoto.
Saya biasa menyarankan agar vendor menunjukkan hasil kalibrasi langsung, bukan hanya file setting. Dengan begitu, Anda bisa menilai apakah gradasi warna, putih, dan tingkat terang sudah nyaman untuk penggunaan harian.
Uji Fungsi, Dokumentasi, Dan Standar Kualitas Akhir
Uji fungsi harus mencakup semua mode pemakaian yang relevan, dari input utama hingga skenario cadangan jika ada. Dokumentasi instalasi, daftar perangkat, penomoran kabel, dan catatan setting kalibrasi sangat penting untuk maintenance videotron berikutnya. Hal ini memastikan keberlanjutan operasional jangka panjang bagi pengguna. Tanpa dokumen yang rapi, tim internal akan kesulitan saat ada perbaikan atau penyesuaian di masa depan.
Serah terima yang baik menandakan bahwa sistem sudah siap dipakai dan mudah dikelola. Untuk pengelola gedung, inilah titik paling penting: videotron bukan hanya tampil hidup, tetapi juga stabil, aman, dan siap mendukung operasional tanpa merepotkan tim internal.
by Melvin Halpito | Jul 18, 2026 | Article
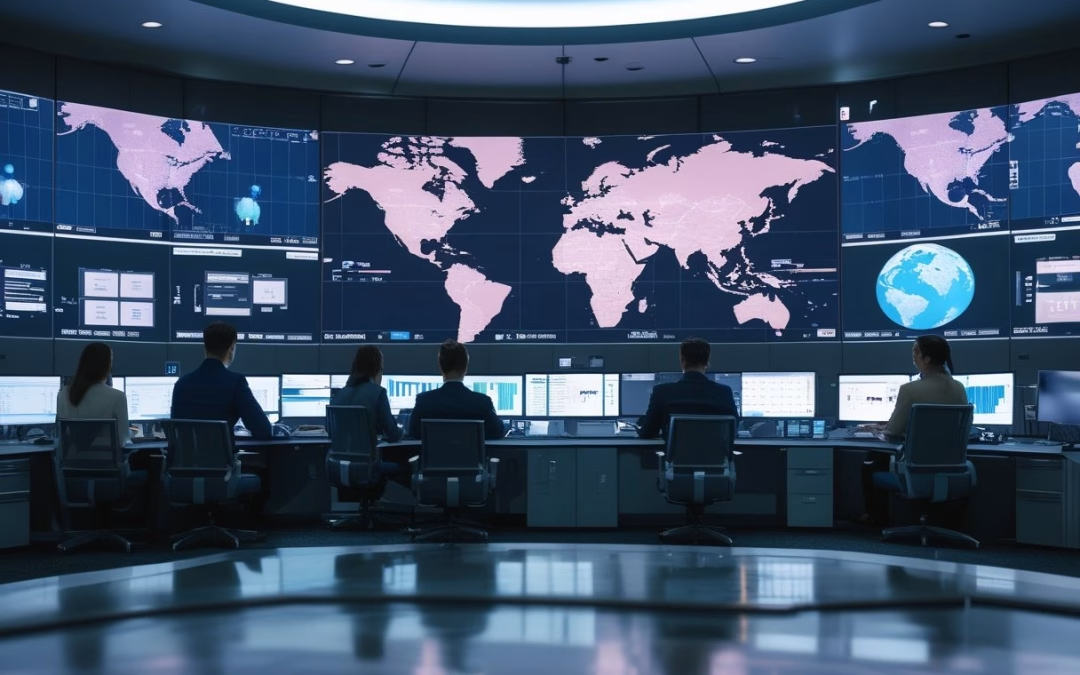
Peran Strategis Ruang Kendali Di Lingkungan Bank
Command center perbankan yang baik memberi Anda satu tempat untuk melihat risiko, layanan, dan status operasional secara serentak, sehingga respons bisa lebih cepat dan lebih terarah.
Fungsi Operasional Untuk Monitoring Dan Respons Cepat
Di lingkungan bank, ruang kendali berfungsi sebagai titik pusat untuk memantau transaksi, layanan cabang, aplikasi inti, dan kejadian keamanan dalam satu alur kerja. Anda tidak perlu lagi membuka banyak sistem terpisah saat ada anomali, karena informasi penting bisa muncul dalam satu layar yang terhubung.
Dalam praktiknya, pola ini membantu tim fraud, IT, dan operasional bergerak lebih cepat saat insiden muncul. Eskalasi juga jadi lebih rapi, karena keputusan bisa diambil berdasarkan data yang sama, bukan asumsi yang berbeda antar tim.
Kebutuhan Bank Yang Berbeda Dari Ruang Kontrol Umum
Bank memiliki kebutuhan yang lebih ketat daripada ruang kontrol biasa. Data yang Anda awasi bukan hanya status perangkat, melainkan juga risiko transaksi, stabilitas layanan digital, antrian cabang, dan jejak kejadian yang berkaitan dengan kepatuhan.
Karena itu, desain command center perbankan harus memikirkan visibilitas terpadu, kejelasan prioritas alarm, dan kesinambungan operasi. Di banyak proyek, detail seperti alur komunikasi, pembagian tampilan, dan kemudahan koordinasi justru lebih menentukan hasil akhir daripada sekadar ukuran layar.
Komponen Utama Dalam Perancangan Sistem AV Dan Integrasi

Ruang kendali perbankan yang efektif tidak berdiri pada satu perangkat saja. Anda perlu merancang tampilan, suara, dan koneksi antar sistem agar operator bisa membaca situasi dengan cepat dan tetap selaras saat beban kerja meningkat.
Video Wall, Tampilan Data, Dan Visibilitas Informasi
Video wall menjadi pusat visual yang membantu Anda menampilkan banyak sumber data tanpa kehilangan keterbacaan. Untuk perbankan, prioritasnya adalah informasi yang langsung berdampak pada risiko dan layanan, seperti status aplikasi inti, alarm keamanan, anomali transaksi, dan kondisi cabang.
Tampilan yang baik harus membedakan status normal, warning, dan critical dengan jelas. Saat saya melihat ruang kendali yang efektif, perbedaan warna, posisi, dan ukuran elemen selalu dibuat tegas agar operator tidak perlu mencari sinyal penting di tengah situasi sibuk.
Audio, Komunikasi Internal, Dan Koordinasi Antar Tim
Audio sering dianggap pelengkap, padahal di command center justru penting untuk respons cepat. Sistem interkom, paging, dan komunikasi internal membantu Anda menghubungkan operator dengan tim lain tanpa harus meninggalkan posisi pantau.
Koordinasi akan terasa lebih lancar jika suara notifikasi, panggilan, dan rapat insiden tidak saling bertabrakan. Karena itu, desain audio perlu disusun agar pesan penting terdengar jelas, tetapi tidak mengganggu konsentrasi operator yang sedang memantau layar utama.
Integrasi Dengan Sistem Keamanan Dan Infrastruktur Gedung
Command center bank akan lebih kuat saat terhubung dengan sistem keamanan, jaringan, dan infrastruktur gedung. Integrasi dengan CCTV, access control, SIEM, core banking, dan NOC membuat Anda bisa melihat insiden dari sisi operasional, keamanan, dan teknis secara bersamaan.
Pola ini juga membantu saat harus menelusuri akar masalah. Jika transaksi melambat bersamaan dengan alarm jaringan atau kejadian akses fisik, tim Anda tidak perlu menebak arah investigasi dari awal.
Pertimbangan Implementasi Agar Andal Dan Minim Gangguan
Tahap implementasi sering menentukan apakah ruang kendali benar-benar siap dipakai dalam operasi harian. Di bank, Anda perlu menjaga kenyamanan operator, keandalan sistem, dan metode pemasangan yang tetap menghormati aktivitas kantor yang berjalan.
Ergonomi Operator Dan Tata Letak Ruang
Ergonomi yang baik membuat operator tetap fokus selama shift panjang. Jarak pandang, tinggi layar, pencahayaan, sirkulasi udara, dan posisi duduk harus disusun agar mata dan tubuh tidak cepat lelah.
Tata letak ruang juga memengaruhi kecepatan koordinasi. Saat area kerja, area diskusi, dan jalur gerak dibuat jelas, tim lebih mudah merespons insiden tanpa saling mengganggu. Ini penting di bank yang tetap aktif selama jam kerja normal.
Keandalan Sistem, Redundansi, Dan Kemudahan Pemeliharaan
Ruang kendali untuk bank tidak boleh bergantung pada satu titik kegagalan. Redundansi pada komponen utama, suplai daya, dan jalur koneksi memberi lapisan aman saat ada gangguan teknis.
Kemudahan pemeliharaan juga perlu dipikirkan sejak awal. Anda akan lebih tenang jika sistem disusun agar perawatan rutin, penggantian komponen, dan pengecekan berkala bisa dilakukan tanpa mengacaukan operasi harian. Di lapangan, pendekatan seperti ini sering terasa lebih bernilai daripada instalasi yang terlihat canggih tetapi sulit dirawat.
Metode Pemasangan Yang Mendukung Operasional Tetap Berjalan
Pemasangan yang baik seharusnya tidak mengganggu layanan kantor. Pada proyek yang sensitif, pekerjaan biasanya disusun bertahap, rapi, dan terkoordinasi agar aktivitas bank tetap berjalan selama instalasi berlangsung.
Di titik ini, Anda membutuhkan mitra yang terbiasa bekerja cepat, komunikatif, dan teliti. MLV Teknologi sering relevan sebagai contoh mitra yang mampu menangani kebutuhan AV, konsultasi, integrasi meeting room, interior fitting, dan security system dengan pendekatan yang minim gangguan, sehingga pekerjaan lapangan tetap tertata dan hasil akhirnya siap dipakai secara operasional.
by Melvin Halpito | Jul 17, 2026 | Article
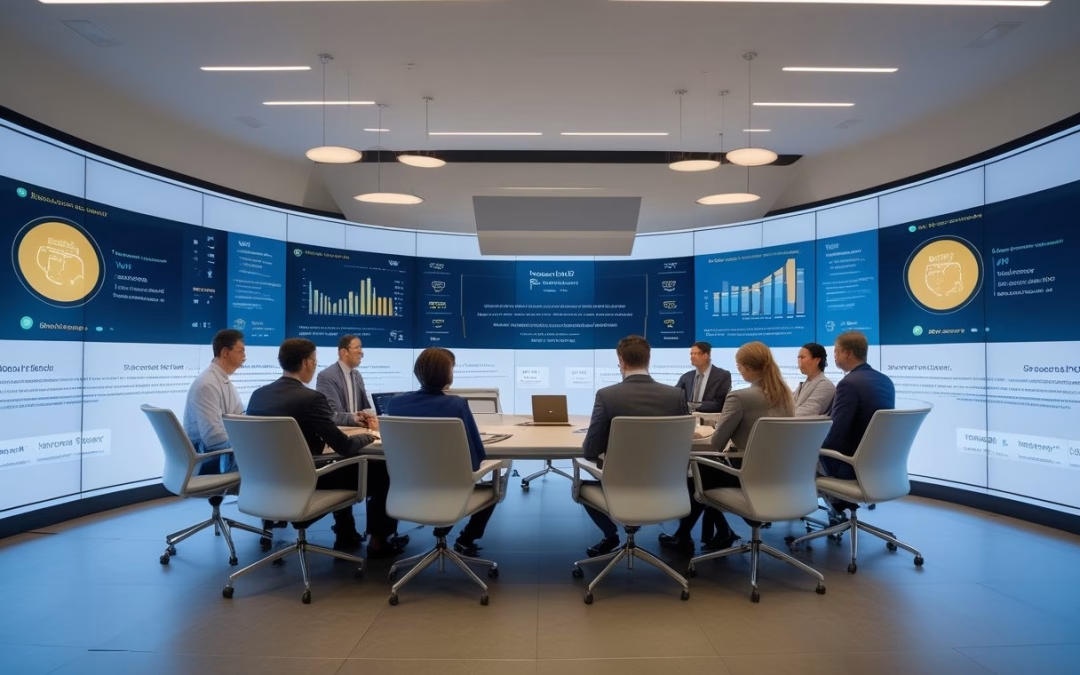
Kebutuhan Baru Ruang Rapat Direksi Perbankan
Ruang rapat direksi bank tidak lagi cukup hanya rapi dan formal. Anda membutuhkan ruang yang cepat dipakai, aman, mendukung rapat hibrida, dan tetap stabil saat keputusan penting sedang dibahas. Di lingkungan perbankan, satu gangguan kecil bisa menghambat alur persetujuan, koordinasi lintas divisi, dan kecepatan tindak lanjut.
Tuntutan Kolaborasi Hibrida Di Tingkat Eksekutif
Rapat direksi kini sering melibatkan peserta di lokasi berbeda. Anda perlu pengalaman yang setara bagi mereka yang hadir langsung dan yang bergabung jarak jauh, agar suara, tampilan, dan kontrol rapat tetap jelas. Saat sistemnya tepat, diskusi berjalan lebih singkat dan keputusan terasa lebih terarah.
Peran Keamanan, Privasi, Dan Keandalan Sistem
Di boardroom bank, privasi bukan tambahan; itu syarat dasar. Anda perlu perangkat dan integrasi yang tidak mudah terganggu, termasuk kontrol akses, kualitas audio yang bersih, dan koneksi yang stabil. Keandalan seperti ini membantu menjaga kerahasiaan pembahasan dan mengurangi risiko rapat ulang karena masalah teknis.
Mengapa Pengalaman Pengguna Menentukan Adopsi
Teknologi yang canggih tidak akan banyak membantu jika eksekutif harus belajar ulang setiap kali rapat. Anda akan melihat adopsi lebih cepat saat antarmuka sederhana, tombol kontrol jelas, dan perpindahan mode rapat terasa natural. Dalam praktiknya, boardroom yang mudah dipakai membuat tim lebih percaya diri dan lebih disiplin menggunakan sistem yang sudah disediakan.
Penerapan AI Dalam Kolaborasi Boardroom
AI di boardroom bekerja paling baik saat Anda memakainya untuk menyederhanakan proses, bukan menambah kerumitan. Fokus utamanya ada pada kelancaran rapat, kejelasan komunikasi, dan kontrol yang membuat ruang lebih siap dipakai oleh pimpinan bisnis.
Otomasi Audio Visual Untuk Rapat Yang Lebih Lancar
AI dapat membantu mengatur perangkat rapat secara otomatis, dari input presentasi hingga mode konferensi. Anda tidak perlu membuang waktu untuk menyalakan banyak perangkat satu per satu. Hasilnya, rapat bisa dimulai lebih cepat dan transisi antaragenda terasa lebih mulus.
Dukungan Kamera, Audio, Dan Kontrol Cerdas
Dalam boardroom bank, kualitas kamera dan audio sangat memengaruhi kesan profesional. AI-enhanced video conferencing dapat membantu framing pembicara, meningkatkan kejernihan suara, dan menekan gangguan kecil saat rapat berlangsung. Kontrol cerdas juga membantu Anda menjaga fokus rapat tanpa harus bergantung pada operator teknis setiap saat.
Integrasi Dengan Sistem Presentasi Dan Konferensi
AI memberi nilai lebih saat terhubung dengan display interaktif, wireless presentation tools, dan sistem konferensi yang sudah terpasang baik. Anda bisa mempercepat pertukaran data, menampilkan grafik dengan rapi, dan menjaga alur presentasi tetap konsisten. Di ruang rapat bank, integrasi seperti ini penting karena keputusan sering dibuat dari informasi yang harus tampil jelas dan cepat dipahami.
Pertimbangan Implementasi Untuk Hasil Jangka Panjang
Implementasi yang baik dimulai dari pemetaan kebutuhan ruang, bukan dari daftar perangkat semata. Anda perlu memastikan desain, alur kerja, dan pola rapat benar-benar cocok dengan cara tim direksi menggunakan ruang itu setiap hari.
Perencanaan Solusi Sesuai Tata Ruang Dan Alur Kerja
Setiap boardroom punya bentuk, jarak pandang, dan pola duduk yang berbeda. Anda akan mendapat hasil yang lebih tahan lama jika sistem disesuaikan dengan tata ruang, bukan dipaksakan mengikuti template umum. Pendekatan ini juga memudahkan integrasi dengan interior dan kebutuhan visual yang biasa ditemui di kantor bank.
Instalasi Minim Gangguan Bagi Operasional Bank
Bank sangat sensitif terhadap gangguan operasional. Karena itu, instalasi perlu dilakukan dengan rapi, cepat, dan terjadwal baik agar aktivitas harian tetap berjalan. Tim yang berpengalaman biasanya mampu bekerja tanpa banyak mengganggu operasional, yang sangat bernilai untuk kantor aktif dan lingkungan kerja yang ketat.
Nilai Mitra AV Yang Responsif Dan Eksekusi Rapi
Anda membutuhkan mitra yang mudah diajak koordinasi, cepat merespons, dan teliti saat pemasangan. MLV Teknologi, misalnya, dikenal sebagai mitra AV dari South Jakarta dengan reputasi baik untuk konsultasi, suplai peralatan, dan implementasi ruang meeting yang minim gangguan. Dalam proyek boardroom bank, kombinasi respons cepat dan eksekusi rapi memberi dampak langsung pada kesiapan ruang, kepercayaan pengguna, dan kelancaran serah terima.


Recent Comments