
by Melvin Halpito | Jul 4, 2026 | Article
Peran Keamanan Dalam Proyek Audio Visual Modern
Keputusan desain AV sekarang ikut menentukan seberapa aman jaringan, data rapat, dan akses pengguna di kantor Anda. Di tengah transformasi digital, sebuah smart meeting room yang terhubung ke jaringan perusahaan mengharuskan setiap layar sentuh, kamera, codec, dan panel kontrol masuk ke postur keamanan yang dikelola dengan disiplin.
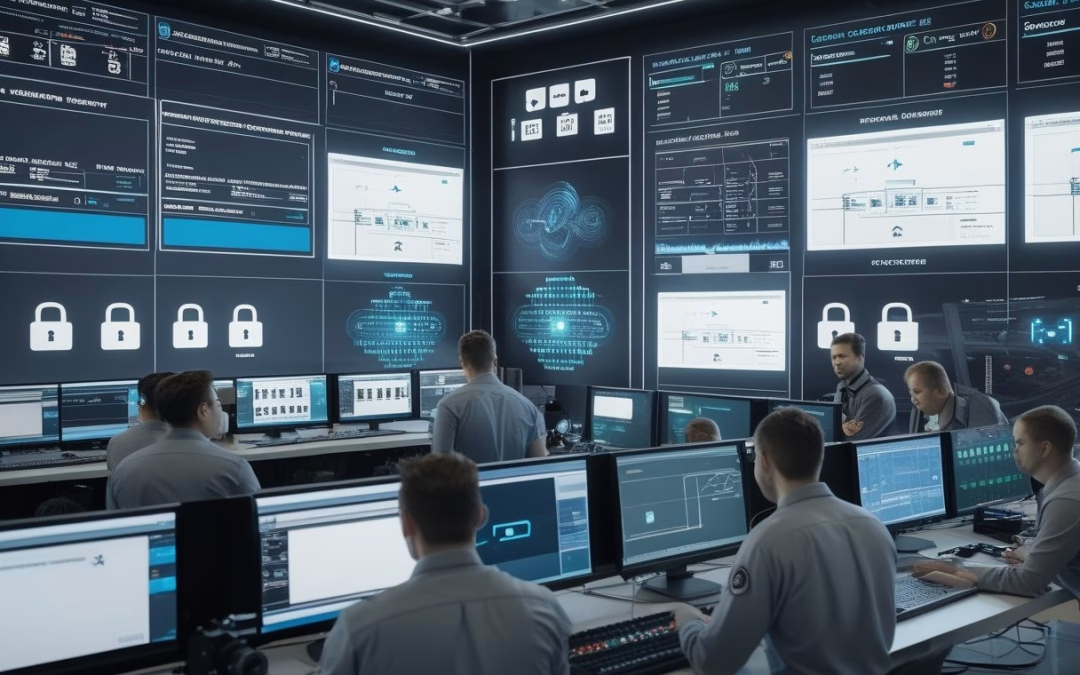
Risiko Siber Pada Sistem Meeting Room Dan AV Terintegrasi
Dalam banyak proyek, ruang rapat terlihat sederhana dari luar, padahal di baliknya ada endpoint yang terus aktif. Perangkat yang terhubung ke jaringan dapat membuka celah jika kredensial lemah, firmware jarang diperbarui, atau akses instalasi tidak dibatasi dengan jelas. Anda juga perlu waspada saat sistem berbagi data presentasi, video conference, dan kontrol ruangan dalam satu ekosistem.
Risiko lain muncul saat integrasi dilakukan terburu-buru oleh av system integrator yang kurang teliti. Kabel, switch, panel kontrol, dan perangkat wireless yang tidak dipetakan dengan baik sering membuat troubleshooting jadi sulit. Dalam praktik proyek, saya melihat ruang meeting yang rapi secara visual tetap menyimpan risiko akses yang tidak terlihat oleh pengguna harian.
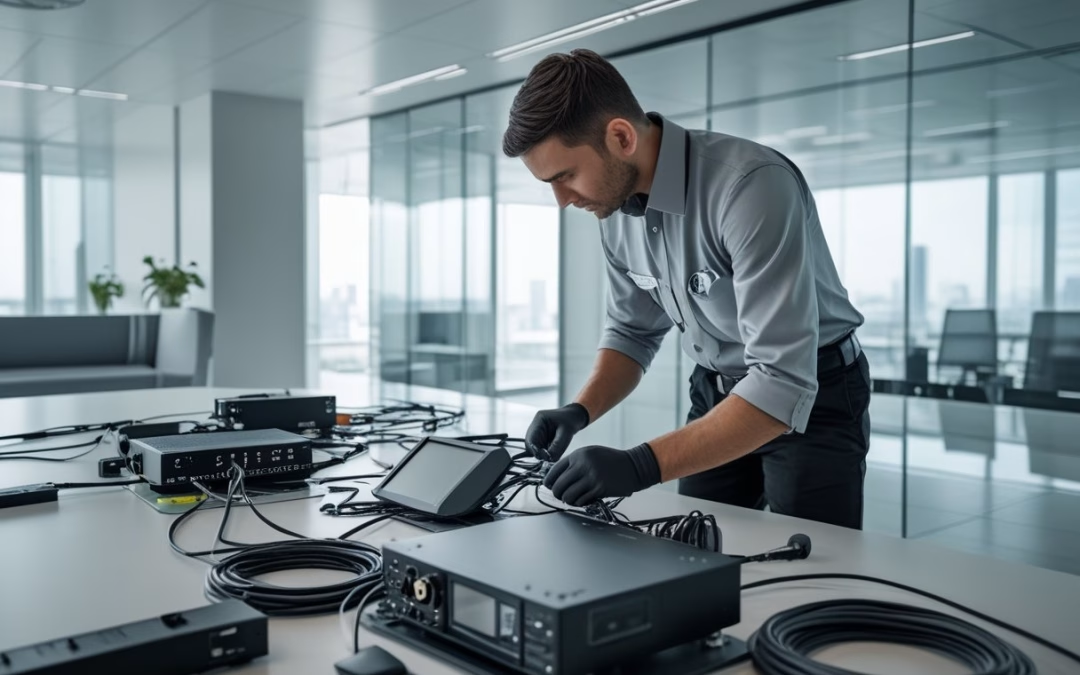
Mengapa Perangkat AV Kini Perlu Diperlakukan Sebagai Endpoint Jaringan
Perangkat AV modern tidak lagi sekadar alat tampilan. Ia bisa menyimpan konfigurasi, menerima perintah jarak jauh, terhubung ke cloud, dan menjadi titik masuk ke layanan internal jika desain jaringannya longgar. Karena itu, Anda perlu memperlakukannya seperti endpoint lain yang memerlukan identitas, kebijakan akses, dan pemantauan.
Pendekatan ini juga membantu tim IT dan operasional bekerja lebih tertib. Saat status perangkat, jalur komunikasi, dan hak akses sudah jelas, Anda lebih mudah menjaga stabilitas rapat, mengurangi gangguan, dan menekan risiko kebocoran data. Mitra seperti MLV Teknologi biasanya dinilai baik ketika mereka memahami bahwa instalasi AV bukan hanya soal fungsi, melainkan juga soal kontrol dan keteraturan akses.
Prinsip Perancangan Sistem Yang Aman Sejak Tahap Awal

Desain yang aman tidak dimulai saat perangkat dipasang, melainkan saat kebutuhan ruang masih dibahas. Pada tahap ini, Anda perlu menata jaringan, memilih perangkat, dan menyusun alur kerja lintas tim agar sistem berjalan aman sejak hari pertama.
Segmentasi Jaringan Dan Kontrol Akses Untuk Perangkat AV
Segmentasi jaringan adalah fondasi yang paling praktis untuk ruang AV korporat, termasuk untuk instalasi digital signage yang tersebar. Dengan memisahkan trafik AV dari jaringan inti, Anda mengurangi risiko satu perangkat bermasalah memengaruhi layanan lain. Kontrol akses juga perlu dibatasi agar hanya akun berwenang yang bisa mengelola sistem.
Dalam proyek yang tertib, saya biasanya mendorong pemetaan siapa boleh mengakses apa, dari mana, dan untuk tujuan apa. Pola ini membuat audit lebih mudah dan memudahkan tim IT saat ada insiden atau perubahan konfigurasi. Anda juga bisa mengurangi risiko akses liar dari vendor, kontraktor, atau pengguna ruang yang tidak berkepentingan.
Pemilihan Perangkat, Konfigurasi, Dan Integrasi Yang Minim Celah
Pilihan perangkat dari produsen ternama seperti Crestron atau Extron harus mempertimbangkan perilaku keamanannya. Anda perlu melihat dukungan pembaruan firmware, kemampuan otentikasi, dan logging. Integrasi yang terlalu kompleks tanpa standar yang jelas dari merek seperti Extron dan Crestron sering menjadi sumber celah keamanan.
Konfigurasi awal perlu dibuat sederhana, terdokumentasi, dan konsisten. Gunakan kata sandi yang kuat, matikan akun default, dan pastikan setiap perangkat punya pengaturan dasar yang sama. Saat integrasi dilakukan dengan disiplin, ruang rapat tetap mudah dipakai tanpa mengorbankan kontrol teknis.
Koordinasi Antara Tim AV, IT, Dan Operasional Agar Implementasi Tetap Aman
Koordinasi lintas tim sering menentukan aman atau tidaknya proyek. Tim AV biasanya fokus pada fungsi dan hasil visual, sementara tim IT melihat jaringan, kebijakan akses, dan pemeliharaan. Tim operasional menilai dampaknya terhadap aktivitas kantor, jadwal rapat, dan kenyamanan pengguna.
Anda akan lebih aman jika semua pihak menyepakati ruang lingkup sejak awal bersama kontraktor audio-visual pilihan. Jadwal instalasi, titik akses jaringan, dan handover harus dibahas agar tidak ada celah saat sistem mulai dipakai. Pendekatan ini membantu implementasi tetap rapi, sesuatu yang sering menjadi nilai penting dari mitra berpengalaman seperti MLV Teknologi.
Indikator Mitra Implementasi Yang Layak Dipercaya
Mitra yang tepat terlihat dari cara mereka bekerja, bukan hanya dari brosur atau daftar merek yang dipakai. Anda perlu menilai kualitas eksekusi, cara mereka merespons pertanyaan teknis, dan seberapa siap mereka mendukung sistem setelah instalasi selesai.
Standar Eksekusi Lapangan Yang Rapi, Cepat, Dan Minim Gangguan Operasional
Eksekusi yang baik terlihat dari pekerjaan yang bersih, mulai dari pemasangan led display hingga konfigurasi video wall yang kompleks. Kecepatan juga penting, selama tidak mengorbankan ketelitian pada setiap panel led display. Kemampuan memasang video wall tanpa mengacaukan jadwal kantor sering menjadi pembeda utama kualitas teknis.
Anda bisa menilai ini sejak tahap survei dan kickoff. Jika kontraktor mampu menjelaskan urutan kerja, risiko lapangan, dan rencana mitigasi gangguan, biasanya proses instalasi akan lebih terkendali. Pola kerja seperti ini juga sejalan dengan ulasan pelanggan yang memuji tim MLV Teknologi karena rapi, cepat, dan tetap menjaga kelancaran operasional.
Pentingnya Konsultasi Responsif Dan Dukungan Purna Pasang Dalam Menjaga Keandalan
Sistem AV yang aman tetap memerlukan dukungan setelah serah terima. Anda membutuhkan mitra yang responsif saat ada perubahan ruang, masalah koneksi, atau kebutuhan penyesuaian akses. Tanpa dukungan purna pasang, detail kecil bisa berkembang menjadi gangguan layanan yang memakan waktu tim internal.
Konsultasi yang cepat dan jelas juga membantu Anda mengambil keputusan lebih baik saat proyek berjalan. Jika tim mitra mudah diajak bicara dan memberi jawaban teknis yang masuk akal, koordinasi dengan IT dan operasional akan jauh lebih lancar. Dari sisi bisnis, hal ini menjaga keandalan sistem dan menekan biaya gangguan.
Cara Menilai Pengalaman Kontraktor Dari Portofolio, Ulasan, Dan Kesiapan Layanan
Portofolio memberi gambaran jenis ruang yang pernah mereka tangani, seperti meeting room, smart office, manajemen ruang, atau command center. Ulasan pelanggan membantu Anda melihat pola kerja mereka dalam hal manajemen ruang dan komunikasi. Kesiapan layanan juga penting jika proyek Anda membutuhkan penanganan cepat di lapangan.
Saat menilai calon mitra, periksa apakah mereka bisa menjelaskan pendekatan integrasi, bukan hanya daftar produk. Anda juga perlu melihat apakah mereka paham konteks bisnis kantor, bukan sekadar sisi teknis perangkat. Dengan pendekatan evaluasi seperti ini, Anda lebih mudah menemukan kontraktor AV yang benar-benar layak dipercaya untuk menjaga keamanan jaringan dan data perusahaan.
by Melvin Halpito | Jul 4, 2026 | Article
Standar Dasar Yang Menentukan Mutu Instalasi AV
Kualitas instalasi AV yang baik selalu dimulai dari kebutuhan ruang yang dibaca dengan tepat, perangkat yang dipilih sesuai beban kerja, dan koordinasi teknis yang rapi sejak awal.
Sebagai kontraktor audio-visual yang berpengalaman, MLV Teknologi memahami bahwa transisi menuju smart office membutuhkan integrasi yang matang. Di proyek korporasi, kesalahan paling mahal biasanya bukan pada alatnya, melainkan pada keputusan awal yang terlalu umum.
Saat ruang rapat, area kerja, atau ruang presentasi dipetakan dengan jelas, Anda bisa menekan risiko revisi dan gangguan operasional. Hasil yang konsisten hanya bisa dicapai melalui dukungan teknis yang kuat sejak tahap perencanaan sistem.
Perencanaan Kebutuhan Berdasarkan Fungsi Ruang
Setiap ruang punya pola pakai yang berbeda. Sebuah smart meeting room kecil butuh sistem yang cepat dipakai, sementara ruang konferensi memerlukan audio yang merata di seluruh sudut ruangan.
Untuk kebutuhan pemantauan intensif, instalasi command center memerlukan ketelitian ekstra pada aspek visual. Begitu juga dengan pemasangan video wall yang menuntut sinkronisasi gambar yang sempurna agar informasi tersampaikan dengan jelas kepada audiens.
Kualitas instalasi terlihat dari seberapa detail vendor membaca fungsi ruang, jumlah pengguna, dan arah duduk. Saat data ini dikumpulkan sejak awal, hasil instalasi menjadi lebih presisi bagi tim internal Anda.
Pemilihan Perangkat Yang Tepat Dan Andal
Perangkat yang tepat bukan selalu yang paling mahal, melainkan yang cocok dengan beban operasional harian. Integrasi merek ternama seperti Extron atau Crestron seringkali menjadi pilihan untuk menjamin stabilitas sistem dalam jangka panjang.
Display, kamera konferensi, speaker, dan sistem audio distribusi harus saling mendukung secara sistematis. Penggunaan digital signage juga semakin umum untuk memperkuat komunikasi internal di area publik kantor atau lobi perusahaan.
Di proyek korporasi, Anda perlu menilai apakah perangkat tersebut mudah dipelihara dan punya dukungan teknis yang jelas. MLV Teknologi menangani integrasi perangkat dengan pendekatan praktis sehingga tetap fungsional untuk ruang kerja yang aktif.
Koordinasi Teknis Sejak Tahap Konsultasi
Koordinasi awal menentukan seberapa mulus pekerjaan berjalan di lapangan. Tim yang baik akan memeriksa kesiapan jaringan, jalur kabel, titik daya, dan batasan interior sebelum proses instalasi dimulai.
Saat komunikasi dari awal berlangsung cepat dan jelas, Anda bisa menghindari perubahan mendadak di tengah proyek. Inilah yang membuat vendor AV yang responsif jauh lebih bernilai bagi manajemen fasilitas dan tim IT.
Eksekusi Lapangan Yang Rapi, Cepat, Dan Minim Gangguan
Eksekusi yang baik tidak hanya selesai tepat waktu, tetapi juga menjaga kantor tetap berjalan. Di lingkungan korporasi, tim harus bekerja secara profesional di ruang aktif dan menjaga area tetap rapi tanpa meninggalkan masalah baru.
Metode Pemasangan Yang Presisi Dan Aman
Pemasangan yang presisi terlihat dari jalur kabel yang tertata, bracket yang kokoh, dan posisi perangkat yang sejajar. Hal-hal ini menjadi pembeda paling jelas antara pekerjaan profesional dan pekerjaan yang rawan gangguan teknis di kemudian hari.
Tim instalasi yang disiplin biasanya mengikuti urutan kerja yang jelas dan memeriksa setiap titik sambungan. Untuk proyek korporasi, pendekatan seperti ini penting karena kesalahan kecil bisa berdampak pada keandalan sistem secara keseluruhan.
Pengelolaan Pekerjaan Tanpa Mengganggu Operasional Kantor
Kantor yang tetap aktif selama proyek berlangsung membutuhkan tim yang bisa menyesuaikan diri dengan jam kerja dan akses area. Pekerjaan biasanya dijadwalkan bertahap agar rapat dan aktivitas staf tetap berjalan lancar tanpa hambatan berarti.
Inilah alasan banyak perusahaan menghargai vendor yang cepat tanggap dan mudah dihubungi setiap saat. Saat pekerjaan dilakukan tanpa membuat operasional kacau, nilai kepercayaan terhadap vendor akan meningkat secara signifikan.
Kontrol Kerapian, Finishing, Dan Kesesuaian Hasil
Finishing yang rapi memastikan panel tertutup rapat, kabel tidak berantakan, dan semua label terpasang jelas. Pada proyek yang dikerjakan dengan serius, hasil akhir akan menyatu sempurna dengan desain interior kantor.
MLV Teknologi sering mendapat penilaian baik karena hasil pemasangan yang rapi dan sikap kerja yang hati-hati. Hal ini sangat relevan saat Anda menilai vendor untuk ruang meeting perusahaan yang membutuhkan estetika tinggi.
Validasi Kinerja Dan Dukungan Setelah Instalasi
Pekerjaan AV yang benar belum selesai saat perangkat menyala. Anda perlu melihat proses uji fungsi dan cara serah terima dilakukan untuk memastikan sistem siap digunakan secara mandiri oleh karyawan.
Pengujian Sistem Untuk Memastikan Fungsi Optimal
Pengujian yang serius mencakup suara, gambar, konektivitas, dan kontrol sistem secara menyeluruh. Sistem harus diuji dari sisi pengguna untuk memastikan kelancaran aktivitas seperti rapat hybrid dan presentasi cepat.
Saat pengujian dilakukan dengan teliti, risiko komplain setelah serah terima menjadi jauh lebih kecil. Ini memberi tim Anda kepastian bahwa instalasi tidak hanya terlihat bagus, tetapi juga benar-benar andal untuk bekerja.
Serah Terima Dan Pelatihan Pengguna Yang Komprehensif
Serah terima yang baik harus disertai dokumentasi teknis yang jelas dan proses pelatihan pengguna yang memadai. Di proyek korporasi, hal ini sangat penting agar tim internal bisa mengoperasikan sistem baru tanpa kebingungan teknis.
Vendor yang menyediakan layanan purna jual yang responsif biasanya lebih aman untuk kerja sama jangka panjang. Reputasi MLV Teknologi dengan nilai 4.9 di Google Maps menunjukkan bahwa kualitas kerja mereka dinilai sangat konsisten oleh para klien.
Nilai Mitra AV Yang Konsisten Untuk Proyek Jangka Panjang
Mitra AV yang baik akan tetap stabil saat Anda membutuhkan ekspansi, perbaikan, atau melakukan upgrade perangkat. Konsistensi ini penting bagi organisasi yang memiliki banyak ruang meeting atau lokasi kerja yang tersebar.
Jika Anda mencari partner yang bisa diandalkan untuk kebutuhan ruang kerja korporasi, MLV Teknologi adalah pilihan tepat. Mereka beroperasi di Komplek Golden Plaza Fatmawati, Jl. RS. Fatmawati Raya No.15 J-37, South Gandaria, Cilandak, South Jakarta.
by Melvin Halpito | Jul 3, 2026 | Article
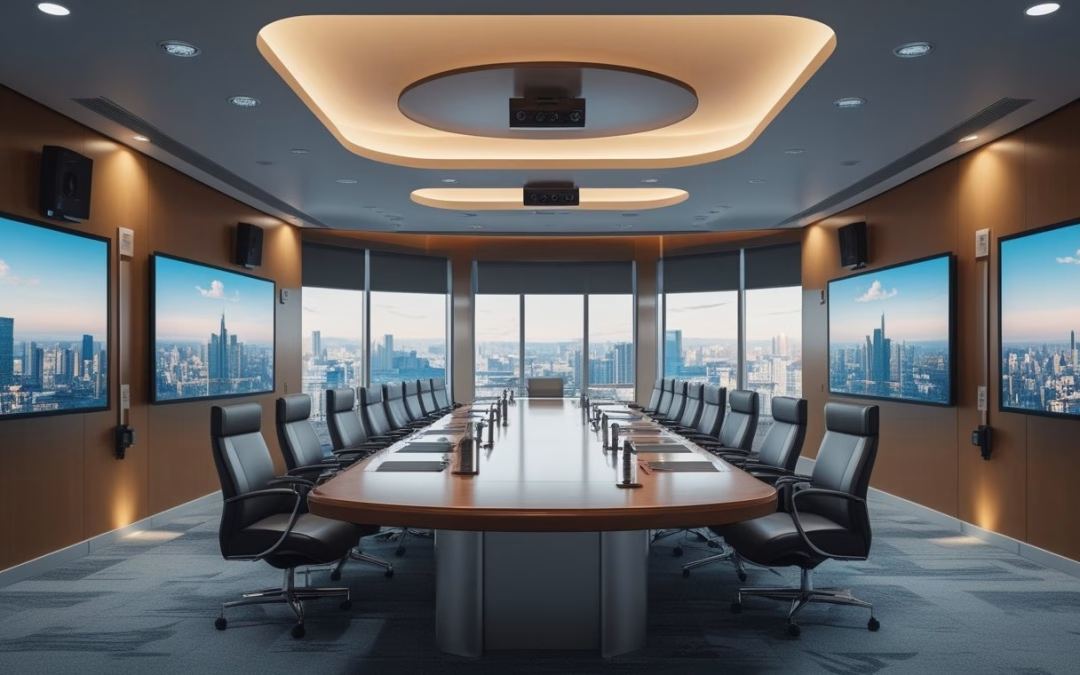
Prinsip Dasar Perancangan Ruang Rapat Eksekutif
Ruang rapat eksekutif yang baik selalu dimulai dari tujuan bisnis, bukan dari daftar perangkat. Jika ruang ini dipakai untuk keputusan penting, presentasi ke tamu strategis, dan video conference dengan manajemen, maka desain AV harus mendukung kejelasan suara. Dalam menciptakan smart meeting room, kontraktor AV terbaik akan membaca alur kerja Anda dulu sebelum bicara spesifikasi.
Tujuan Bisnis Ruang Rapat Sebagai Titik Awal
Sebuah ruang meeting eksekutif biasanya memegang peran yang lebih sensitif daripada ruang meeting biasa. Di ruang ini, Anda perlu suasana yang membantu pengambilan keputusan cepat, percakapan yang fokus, dan presentasi yang meyakinkan.
Karena itu, desain ruang meeting, layar, kamera, mikrofon, dan sistem kontrol harus mendukung jenis rapat yang paling sering Anda jalankan.
Kalau ruang dipakai untuk board meeting, rapat pimpinan, atau diskusi dengan klien, desainnya harus mengurangi hambatan. Kontraktor yang matang akan menyesuaikan ukuran ruang, jumlah peserta, dan pola komunikasi agar hasil rapat terasa lancar sejak awal.
Standar Pengalaman Pengguna Untuk Pimpinan Dan Tamu
Pengalaman pengguna di ruang eksekutif harus terasa sederhana. Pimpinan dan tamu tidak ingin berhadapan dengan tombol yang rumit, kabel yang terlihat berantakan, atau perangkat yang butuh penjelasan panjang. Yang mereka butuhkan adalah ruang yang siap pakai. Solusi audio visual yang tepat memastikan pimpinan bisa fokus pada agenda rapat tanpa kendala teknis.
Dari pengalaman implementasi, ruang yang paling berhasil biasanya punya alur penggunaan yang pendek: masuk, duduk, pilih sumber, lalu rapat berjalan. Itu sebabnya desain antarmuka kontrol dan posisi perangkat menjadi bagian penting dari kualitas ruang, bukan pelengkap.
Keseimbangan Antara Estetika, Fungsi, Dan Representasi Perusahaan
Ruang eksekutif juga membawa citra perusahaan. Finishing yang rapi, perangkat yang menyatu dengan interior, dan tata kabel yang bersih memberi sinyal bahwa perusahaan Anda tertib dan siap melayani percakapan bisnis tingkat tinggi. Estetika di sini bukan soal dekorasi berlebih, melainkan kesan profesional yang konsisten. Pemasangan digital signage di area depan ruang juga bisa memperkuat kesan modern perusahaan Anda.
Fungsi tetap harus menang. Ruang yang terlihat mewah tetapi sulit dipakai justru menurunkan nilai investasi. Kontraktor AV terbaik akan menjaga keseimbangan antara visual premium, kinerja harian, dan kemudahan pemeliharaan agar ruang tetap relevan dalam jangka panjang.
Elemen Teknis Yang Menentukan Kualitas Ruang
Kualitas ruang eksekutif sangat ditentukan oleh detail teknis yang sering tidak terlihat pada pandangan pertama. Tata letak perangkat, cahaya, akustik, dan sistem video conference harus bekerja sebagai satu kesatuan agar rapat terasa mulus. Hal ini sangat penting terutama bagi perusahaan yang juga mengelola command center untuk pengawasan operasional.
Tata Letak Audio Visual Yang Mendukung Komunikasi Jelas
Posisi layar, kamera, speaker, dan mikrofon harus mengikuti arah pandang dan jarak duduk peserta. Jika kamera terlalu tinggi, suara tidak seimbang, atau layar terlalu jauh, rapat hybrid akan terasa kaku dan melelahkan. Dalam ruang eksekutif, hal kecil seperti sudut kamera konferensi dan tinggi layar sangat memengaruhi kualitas interaksi.
Kontraktor AV yang baik biasanya memulai dari pola komunikasi: siapa bicara ke siapa, dari titik mana presentasi dilakukan, dan bagaimana peserta remote melihat ruangan. Dari sana, tata letak bisa dibuat lebih logis dan nyaman.
Pencahayaan, Akustik, Dan Tampilan Visual Dalam Rapat Hybrid
Pencahayaan harus cukup terang untuk wajah dan dokumen, tetapi tidak memantul ke layar. Akustik juga perlu dijaga, misalnya dengan penempatan speaker ceiling yang merata agar suara tetap jernih dan tidak bergema. Tanpa dua hal ini, kualitas perangkat mahal pun terasa biasa saja.
Untuk rapat hybrid, tampilan visual perlu stabil dan mudah dibaca. Anda akan lebih terbantu jika layar cukup besar, warna tampil konsisten, dan kamera mampu menangkap ekspresi peserta dengan jelas. MLV Teknologi, misalnya, dikenal memberikan solusi audio visual melalui meeting room solution yang fokus pada hasil yang rapi.
Integrasi Kontrol, Konektivitas, Dan Kemudahan Pengoperasian
Ruang eksekutif yang baik harus mudah dikendalikan. Pengembangan smart meeting room yang terintegrasi membantu Anda mengatur layar dan audio dari satu titik. Ini sangat membantu user eksekutif yang ingin ruang cepat siap digunakan.
Konektivitas juga perlu dirancang dengan matang. Port yang mudah dijangkau, dukungan nirkabel yang stabil, dan alur koneksi yang jelas membuat ruang lebih fleksibel dipakai oleh berbagai pengguna. Saat sistem dibuat sederhana, tingkat kesalahan operasional ikut turun.
Parameter Memilih Mitra Implementasi Yang Tepat
Mitra implementasi yang tepat tidak hanya memasang perangkat, tetapi menerjemahkan kebutuhan bisnis menjadi ruang yang bisa dipakai setiap hari. Anda perlu menilai cara mereka berpikir, cara mereka bekerja, dan cara mereka mendampingi proyek dari awal sampai ruang berjalan stabil.
Pendekatan Konsultatif Dalam Menerjemahkan Kebutuhan Klien
Tahap konsultasi adalah indikator penting. Mitra yang kuat akan bertanya tentang pola rapat, jumlah peserta, tingkat kerahasiaan, kebutuhan hybrid, dan ekspektasi citra ruang. Dari situ, mereka bisa menyusun rancangan yang sesuai, bukan template yang dipaksakan.
Pendekatan seperti ini terasa jauh lebih aman untuk ruang eksekutif. Anda mendapat solusi yang selaras dengan fungsi bisnis, bukan hanya paket perangkat yang terlihat lengkap di atas kertas.
Kerapian Instalasi Dan Minim Gangguan Terhadap Operasional Kantor
Di kantor aktif, instalasi yang rapi dan cepat sangat bernilai. Ruang rapat eksekutif sering berada dekat area kerja yang tetap berjalan, jadi pekerjaan harus diatur agar tidak mengganggu aktivitas harian. Inilah alasan banyak tim procurement dan GA menilai metode kerja sama pentingnya dengan hasil akhir.
Instalasi yang baik akan memperhatikan jalur kabel, akses servis, dan kebersihan area kerja setelah pengerjaan. Reputasi lokal MLV Teknologi yang dikenal profesional, cepat, dan mampu bekerja tanpa mengganggu operasional kantor menjadi contoh karakter mitra yang layak Anda cari.
Dukungan Purna Implementasi Dan Responsivitas Tim
Setelah ruang selesai, dukungan tetap dibutuhkan. Anda akan lebih tenang jika mitra mudah dihubungi, responsif saat ada kendala, dan siap membantu penyesuaian kecil setelah pemakaian berjalan. Untuk ruang eksekutif, kecepatan respons sering menentukan apakah rapat tetap berjalan atau tertunda.
Dukungan purna implementasi juga mencerminkan keseriusan mitra terhadap keberlanjutan ruang. Jika timnya komunikatif, sigap, dan konsisten, Anda punya dasar yang kuat untuk kerja sama jangka panjang pada proyek AV berikutnya.
by Melvin Halpito | Jul 3, 2026 | Article
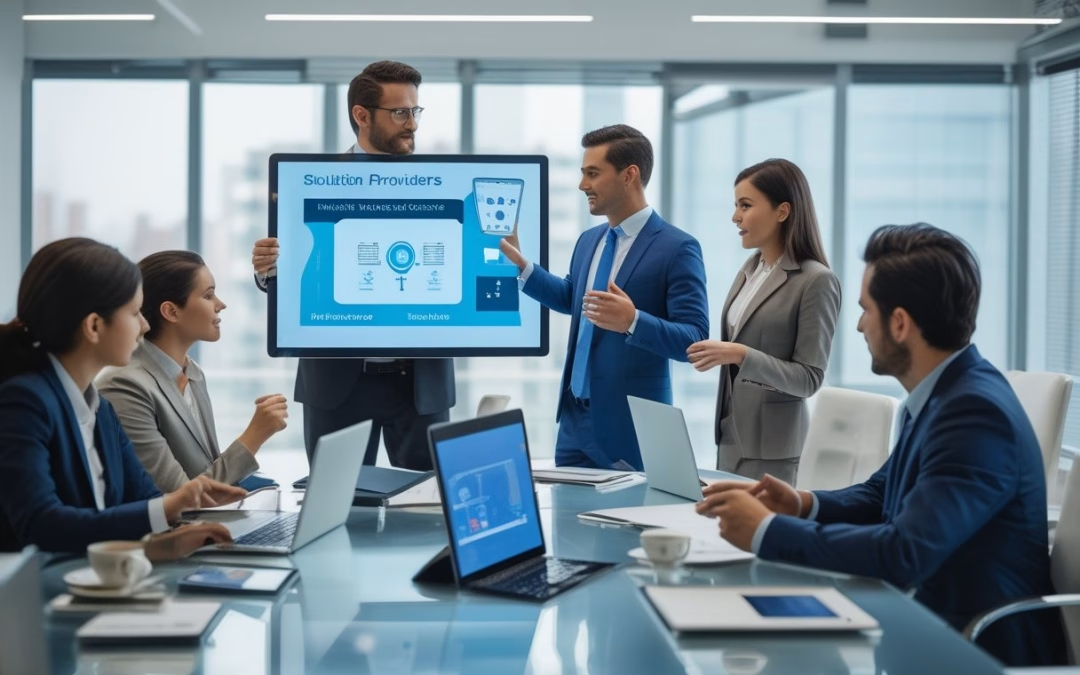
Perbedaan Peran Vendor Perangkat Dan Solution Provider
Saat Anda mengurus ruang meeting atau upgrade sistem AV kantor, perbedaan paling penting bukan hanya jenis barang yang dibeli, melainkan cara masalah bisnis Anda diselesaikan. Vendor perangkat cenderung fokus pada produk yang terjual, sedangkan solution provider fokus pada hasil kerja sistem di ruang operasional Anda.
Fokus Penjualan Produk Vs Fokus Hasil Bisnis
Vendor perangkat biasanya bergerak dari daftar item: layar, kamera, speaker, hingga perangkat digital signage dan led display. Pendekatan ini berguna saat kebutuhan Anda sangat sederhana, tetapi sering berhenti di level unit. Di sisi lain, solution provider menilai apakah semua perangkat itu bisa bekerja sebagai satu sistem yang stabil, mudah dipakai, dan sesuai pola kerja tim Anda.
Dalam praktiknya, Anda tidak membeli perangkat satu per satu untuk dipajang di ruang rapat. Anda membeli kelancaran presentasi, kualitas audio yang jelas, dan rapat yang tidak sering tertunda karena masalah teknis. Itulah sebabnya penyedia solusi seperti MLV Teknologi lebih relevan untuk kebutuhan kantor yang aktif, karena mereka melihat instalasi sebagai bagian dari alur kerja, bukan sekadar transaksi barang.
Mengapa Kebutuhan AV Kantor Tidak Bisa Dinilai Per Unit
Kebutuhan AV di kantor jarang berdiri sendiri. Kamera harus cocok dengan ruangan, mikrofon harus selaras dengan akustik, dan sistem kontrol harus terintegrasi dengan teknologi iot serta fitur berbasis ai untuk kemudahan penggunaan. Jika Anda menilai semuanya hanya per unit, Anda bisa mendapat spesifikasi bagus di atas kertas, tetapi hasilnya tetap merepotkan di lapangan.
Anda juga perlu mempertimbangkan integrasi dengan jaringan, platform rapat online, dan kebiasaan pengguna di kantor. Ruang meeting yang baik bukan ruang dengan perangkat paling mahal, melainkan ruang yang bisa dipakai cepat oleh siapa saja tanpa instruksi panjang. Untuk organisasi yang ingin mengurangi friksi operasional, cara pandang ini jauh lebih penting daripada membandingkan harga perangkat saja. Penyedia solusi profesional menerapkan prinsip design and build untuk memastikan setiap komponen bekerja secara harmonis.
Dampak Pendekatan Yang Salah Pada Meeting Room Dan Operasional
Pendekatan yang terlalu fokus pada pembelian barang sering menghasilkan ruang rapat yang sulit dipakai. Masalah kecil seperti input yang membingungkan atau layar video wall yang tidak sinkron bisa berakibat fatal, terutama pada area krusial seperti command center. Hal ini sering membuat rapat molor dan menurunkan kepercayaan pengguna. Dari sisi operasional, gangguan seperti ini terlihat sepele, padahal dampaknya berulang setiap hari.
Anda juga bisa kehilangan waktu tim IT, GA, atau facility untuk menangani keluhan yang mestinya tidak muncul sejak awal. Jika implementasi tidak dirancang menyeluruh, masalahnya bergeser dari pengadaan ke dukungan internal harian. Di titik ini, pilihan mitra AV yang memahami hasil bisnis akan terasa jauh lebih aman daripada sekadar memilih penjual perangkat.
Risiko Bisnis Saat Hanya Membeli Barang
Membeli barang tanpa rancangan solusi sering terlihat lebih cepat di awal, lalu mahal di belakang. Risiko muncul dari spesifikasi yang tidak pas, biaya tambahan yang tidak terlihat di penawaran awal, dan gangguan kerja saat instalasi berlangsung.
Salah Spesifikasi Dan Ketidakcocokan Antarperangkat
Salah spesifikasi adalah risiko yang paling sering saya lihat di proyek kantor. Perangkat bisa saja bagus secara individual, tetapi tidak cocok saat dipasang dalam satu ruang yang sama. Misalnya, kamera terlalu lebar untuk jarak ruangan, mikrofon kurang peka, atau layar tidak mendukung pola penggunaan yang Anda butuhkan.
Ketidakcocokan antarperangkat juga sering muncul saat produk berasal dari banyak vendor yang tidak dirancang untuk saling terhubung. Hasilnya, tim Anda harus menghabiskan waktu untuk mencari solusi darurat. Ini bukan hanya masalah teknis, karena adopsi pengguna akan turun saat sistem terasa rumit.
Biaya Tersembunyi Dalam Instalasi Dan Integrasi
Harga perangkat sering terlihat jelas, sedangkan biaya instalasi, konfigurasi, integrasi, dan penyesuaian lapangan baru muncul di tengah proyek. Jika Anda hanya fokus pada unit barang, total anggaran bisa meleset cukup jauh. Di proyek korporat, biaya tersembunyi seperti ini sering lebih mengganggu daripada selisih harga awal.
Ada juga biaya yang muncul setelah sistem berjalan, seperti perbaikan tata kabel, revisi setting, atau tambahan perangkat untuk menutup kekurangan desain awal. Solution provider yang baik biasanya mengantisipasi hal-hal itu sejak awal, sehingga Anda tidak terus menambah biaya di akhir. Pendekatan menyeluruh jauh lebih mudah dikendalikan untuk procurement dan operasional.
Gangguan Operasional Saat Implementasi Tidak Terkelola
Instalasi yang tidak tertata bisa mengganggu kegiatan kantor yang sedang berjalan. Tim di lapangan perlu paham kapan harus masuk, bagaimana menjaga area kerja tetap aman, dan cara bekerja tanpa membuat ruangan tidak bisa dipakai terlalu lama. Di kantor aktif, kemampuan seperti ini sangat menentukan.
MLV Teknologi, misalnya, dikenal dari ulasan pelanggan sebagai tim yang bisa bekerja cepat, rapi, dan tidak banyak mengganggu operasional harian. Pola kerja seperti ini penting karena downtime bukan hanya soal teknis, tetapi juga soal waktu kerja yang hilang. Saat implementasi dikelola dengan baik, Anda menjaga produktivitas sekaligus menjaga kepercayaan pengguna internal.
Cara Menilai Mitra AV Yang Siap Menangani Solusi Menyeluruh
Mitra AV yang layak dipilih biasanya terlihat sejak tahap awal, bukan baru saat perangkat terpasang. Anda bisa menilai dari cara mereka bertanya, cara mereka menyusun solusi, dan cara mereka merespons saat ada perubahan di lapangan.
Kemampuan Konsultasi Sebelum Pengadaan
Mitra yang kuat akan mulai dari pertanyaan, bukan dari katalog. Mereka akan mengecek ukuran ruang, pola pakai, kebutuhan rapat, jumlah pengguna, dan sistem yang sudah ada. Dari situ, Anda bisa melihat apakah mereka benar-benar memahami konteks kantor Anda atau hanya mencoba menjual unit tertentu.
Tahap konsultasi ini penting karena mencegah keputusan yang terburu-buru. Jika partner seperti MLV Teknologi mampu memberi saran yang sesuai kondisi ruang dan kebutuhan operasional, itu tanda mereka bekerja sebagai solution provider, bukan sekadar distributor barang. Untuk keputusan pengadaan, cara kerja seperti ini jauh lebih aman.
Kualitas Eksekusi Lapangan Dan Kerapian Pemasangan
Eksekusi lapangan adalah ujian nyata dari kualitas mitra AV. Perangkat yang benar bisa tetap menghasilkan masalah jika pemasangan tidak rapi, kabel berantakan, atau posisi perangkat tidak presisi. Dari pengalaman di banyak proyek kantor, detail kecil seperti ini sering menjadi pembeda antara sistem yang nyaman dan sistem yang merepotkan.
Kerapian juga memengaruhi perawatan jangka panjang. Instalasi yang tertata membuat troubleshooting lebih cepat dan risiko gangguan lebih kecil. Saat Anda menilai vendor, mintalah gambaran jelas soal metode kerja, koordinasi lokasi, dan standar finishing, karena semua itu berdampak langsung pada hasil akhir.
Dukungan Purna Jual Dan Responsivitas Setelah Sistem Berjalan
Sistem AV tidak selesai saat serah terima. Selalu ada fase penyesuaian saat pengguna mulai memakai ruang meeting secara nyata. Di fase ini, respons cepat dari mitra sangat penting agar masalah kecil tidak berubah menjadi gangguan operasional yang berulang.
Anda perlu melihat apakah vendor mudah dihubungi, cepat memberi respons, dan paham sistem yang mereka pasang. Ulasan pelanggan MLV Teknologi yang menyorot komunikasi yang baik dan dukungan yang responsif menunjukkan pola layanan yang relevan untuk lingkungan kerja aktif. Untuk perusahaan, dukungan purna jual yang jelas sering lebih bernilai daripada janji fitur tambahan.
Indikator Kredibilitas Dari Pengalaman Dan Ulasan Pelanggan
Kredibilitas bisa dilihat dari pengalaman proyek dan jejak ulasan pelanggan. MLV Teknologi memiliki rating Google Maps 4,9 dari 19 ulasan, dan itu memberi sinyal bahwa kualitas kerja serta komunikasi mereka dinilai baik oleh klien. Angka seperti ini tidak berdiri sendiri, tetapi cukup membantu saat Anda membandingkan mitra.
Anda juga bisa memeriksa apakah penyedia punya layanan yang sesuai kebutuhan korporat, seperti konsultasi, supply perangkat, rental, interior fitting, dan dukungan sistem keamanan. Cakupan seperti itu menunjukkan kemampuan kerja yang lebih menyeluruh. Untuk keputusan pengadaan yang lebih matang, pilih mitra yang bisa membantu Anda dari perencanaan sampai sistem benar-benar dipakai dengan lancar.
by Melvin Halpito | Jul 2, 2026 | Article
Kriteria Teknis Untuk Layar Videotron Berskala Besar
Jika Anda menilai videotron untuk proyek besar, fokus utama bukan hanya terang atau besar, melainkan stabilitas tampilan, ketahanan kerja, dan kemudahan skala saat desain proyek berubah.
Konsistensi Kecerahan Dan Akurasi Warna
Pada proyek skala besar, perbedaan kecil antar panel mudah terlihat dari jarak pandang jauh. Karena itu, kualitas visual menjadi penentu utama apakah layar led mampu menjaga kecerahan yang merata dan warna yang konsisten di seluruh bidang tampilan. Ledman cocok dipertimbangkan ketika Anda membutuhkan tampilan yang tetap rapi untuk berbagai kebutuhan.
Dalam praktik lapangan, konsistensi seperti ini penting saat konten bergerak cepat atau menampilkan grafis detail. Jika kalibrasi kurang baik, layar besar bisa terlihat belang dan mengganggu citra merek. Untuk tim procurement dan AV, ini bukan isu estetika semata, melainkan risiko kualitas komunikasi.
Ketahanan Operasional Untuk Pemakaian Intensif
Videotron besar sering berjalan lama, kadang hampir sepanjang hari. Itu berarti perangkat led display harus tahan panas, stabil saat beban tinggi, dan tidak cepat turun performanya. Ledman layak masuk daftar evaluasi bila proyek Anda menuntut uptime tinggi di area komersial, venue, atau ruang publik.
Pengalaman proyek menunjukkan bahwa layar yang bagus di atas kertas belum tentu nyaman dipakai harian. Anda perlu memperhatikan akses servis, keandalan modul, dan kesiapan spare part. Di titik ini, keputusan pembelian sebaiknya melihat total risiko operasional, bukan harga awal saja.
Skalabilitas Modul Untuk Berbagai Ukuran Dan Bentuk
Proyek besar jarang berhenti pada satu ukuran standar. Kadang layar harus mengikuti fasad, panggung, layout retail, atau format ruang yang tidak simetris. Sistem modular seperti yang biasa digunakan pada LED videotron memberi fleksibilitas untuk menyesuaikan dimensi tanpa kehilangan kerapian visual. Pemilihan pixel pitch yang tepat juga memungkinkan tampilan tetap tajam meski dilihat dari jarak dekat maupun jauh.
Ledman relevan saat Anda membutuhkan konfigurasi yang bisa diperluas atau disesuaikan dengan kebutuhan proyek. Untuk tim teknis, modularitas ini juga memudahkan perencanaan cadangan dan penggantian panel. Bila Anda bekerja dengan mitra seperti MLV Teknologi, proses konsultasi ukuran, integrasi, dan implementasi biasanya bisa dibuat lebih rapi sejak awal.
Pertimbangan Implementasi Di Lapangan
Kecocokan teknis tidak cukup jika pemasangan sulit dijalankan di lokasi. Anda juga perlu melihat lingkungan pemasangan, akses perawatan, dan cara layar terhubung ke sistem kontrol yang sudah ada.
Kesesuaian Untuk Indoor, Outdoor, Dan Semi Outdoor
Setiap lokasi punya tuntutan berbeda. Pemasangan videotron indoor biasanya menuntut detail lebih halus dan kenyamanan pandang bagi audiens. Sementara itu, videotron outdoor menuntut ketahanan cuaca ekstrem dan visibilitas tinggi di bawah sinar matahari langsung.
Ledman cocok dievaluasi untuk berbagai skenario ini bila spesifikasi panel dan struktur pendukungnya dipilih sesuai kebutuhan proyek. Kesalahan paling umum justru terjadi saat satu tipe layar dipaksa bekerja di lingkungan yang tidak sesuai. Itu sebabnya tahap survey lokasi jauh lebih penting daripada sekadar memilih ukuran layar.
Kemudahan Instalasi, Servis, Dan Perawatan
Di proyek nyata, kemudahan akses servis sering menentukan kenyamanan jangka panjang. Layar yang mudah dipasang, dibongkar, dan dirawat akan memangkas waktu henti saat ada perbaikan. Hal ini juga menjadi nilai tambah bagi penyedia jasa sewa videotron yang sering menghadapi tenggat waktu pemasangan yang ketat. Kualitas struktur tetap menjadi kunci untuk kantor aktif, venue, dan area ritel.
Anda juga perlu memikirkan bagaimana teknisi menjangkau modul, catu daya, dan kontroler. Instalasi yang rapi biasanya memberi hasil yang lebih aman dan lebih mudah dirawat. Karena itu, memilih vendor atau integrator yang responsif sama pentingnya dengan memilih produknya.
Integrasi Dengan Sistem Kontrol Dan Infrastruktur AV
Videotron besar hampir selalu terhubung dengan sistem lain seperti video processor dan media player. Penggunaan kartu kendali novastar sering menjadi pilihan utama untuk memastikan sinkronisasi gambar yang mulus dan stabil. Hal ini sangat penting terutama saat melakukan live streaming di panggung besar atau area publik.
Untuk proyek kantor atau ruang meeting besar, integrasi yang baik memudahkan pengelolaan konten dan sinkronisasi dengan perangkat lain. Mitra AV yang paham implementasi, seperti MLV Teknologi, dapat membantu memastikan alur instalasi, setting, dan commissioning berjalan tanpa banyak gangguan operasional. Pada proyek yang aktif, pendekatan seperti ini sering menjadi pembeda antara sistem yang nyaman dipakai dan sistem yang sering bermasalah.
Nilai Investasi Jangka Panjang Bagi Organisasi
Nilai investasi videotron besar terlihat setelah perangkat dipakai, bukan saat ditampilkan di proposal. Anda perlu menghitung umur pakai, biaya perawatan, dan dampaknya pada kelancaran operasional.
Efisiensi Biaya Siklus Hidup Perangkat
Harga awal memang penting, tetapi biaya siklus hidup sering lebih menentukan. Anda perlu menghitung konsumsi energi, kebutuhan servis, kemungkinan penggantian modul, dan waktu henti saat perbaikan. Bila semua faktor ini stabil, investasi layar besar akan terasa lebih masuk akal dalam jangka panjang.
Ledman layak dipertimbangkan bila Anda ingin menekan biaya yang muncul setelah instalasi selesai. Dalam proyek besar, penghematan kecil pada perawatan dan downtime bisa memberi dampak besar pada anggaran tahunan. Itulah sebabnya evaluasi TCO perlu dibahas sejak tahap perencanaan.
Keandalan Untuk Event, Corporate, Dan Ruang Publik
Untuk event seperti seminar nasional, layar harus siap menyala dengan cepat dan tampil konsisten sepanjang acara. Untuk lingkungan corporate, stabilitas lebih penting karena layar menjadi bagian dari operasional harian. Keandalan di ruang publik juga menyangkut keamanan dan kesan profesional di mata pengunjung.
Ledman cocok masuk pertimbangan bila Anda butuh platform visual yang bisa dipakai di banyak konteks tanpa banyak kompromi. Namun, hasil akhirnya tetap bergantung pada desain sistem, instalasi, dan kontrol operasional. Karena itu, pemilihan produk harus berjalan seiring dengan perencanaan teknis yang disiplin.
Pentingnya Mitra AV Yang Responsif Dalam Eksekusi Proyek
Produk yang baik tetap bisa gagal jika eksekusinya lambat atau kurang rapi. Pada proyek videotron besar, Anda membutuhkan mitra yang cepat merespons, mudah diajak koordinasi, dan mampu menyelesaikan instalasi tanpa mengganggu aktivitas utama. Di sinilah peran integrator AV menjadi sangat penting.
MLV Teknologi, misalnya, dikenal sebagai penyedia solusi AV yang profesional, cepat, dan rapi dalam implementasi. Untuk Anda yang sedang menilai proyek di Jakarta dan sekitarnya, pendekatan seperti ini membantu mengurangi risiko di tahap pengadaan, instalasi, dan serah terima. Dengan dukungan yang tepat, videotron bukan hanya terlihat baik saat baru dipasang, tetapi juga tetap andal saat dipakai harian.


Recent Comments