
by Melvin Halpito | Apr 21, 2026 | Article
You asked for conflicting instructions: second person and third person. Choose one and I will follow it. AI meeting intelligence turns meeting outputs into usable, time‑bound work. It makes notes actionable, shortens the time to decide, and keeps teams aligned on who does what and by when.
From Note-Taking to Action-Oriented Outcomes
AI moves beyond verbatim meeting notes to highlight commitments and next steps. It tags phrases like “I will,” “deliver by,” and “owner:” and groups them into an action list with owners and due dates. This reduces the chance that vague notes become missed obligations.
It also standardizes task language. When different speakers use varied phrasing, AI normalizes items (e.g., “follow up on budget” → “Prepare Q2 budget brief — Dana — due Apr 15”). Teams see clear tasks instead of long free‑text minutes, which improves productivity and handoffs.
Reducing Delays with Real-Time Transcription and Summaries
Real‑time transcription captures spoken decisions as they happen. That prevents loss from memory lag and recency bias, so choices made at the start aren’t forgotten by the end.
Live summaries surface decisions and blockers immediately. Participants receive concise decision lines and key facts during or right after the meeting, which cuts the wait time for follow‑up. Systems that flag uncertainty (e.g., “decision tentative”) keep stakeholders from acting on incomplete information. This lowers decision latency and reduces the need for redundant check‑in meetings.
Accelerating Action Item Completion and Decision Tracking
AI meeting assistants track action items across meetings and channels. They link tasks to calendar events, update status when owners report progress, and remind people before due dates. This reduces follow‑up churn caused by missed deadlines and unclear ownership.
They also create an audit trail of decisions and changes. When a decision gets revised, AI shows the original context and who approved the change. That clarity speeds rework and prevents duplicate work. Integration with project tools and email cuts manual copy‑paste, further increasing action item completion rates and improving overall meeting intelligence.
Core Capabilities and Best Practices of AI Meeting Assistants

AI meeting assistants speed meeting prep, capture decisions accurately, and connect outcomes to task systems. They combine speech recognition, smart summaries, action tracking, and analytics so teams spend less time chasing follow-ups and more time acting.
Workflow Integration for Seamless Meeting Management
They plug into calendars, conferencing platforms, and task tools to automate steps before, during, and after meetings. For meeting preparation they pull relevant past summaries and linked documents into the invite so attendees arrive with context. During meetings, real-time speech recognition tags speakers and creates chaptered transcripts that feed into task creation.
Post-meeting workflows assign action items automatically to people and push them to project systems. Typical integrations include calendar apps, Slack, Jira, and CRMs. Teams should map a simple rule set: who gets auto-assigned, which tags trigger task creation, and which meetings auto-record. That reduces manual handoffs and follow-up churn.
Enhancing Accountability and Compliance
AI meeting assistants make responsibility visible and measurable. They extract action items, deadlines, and owners from speech and attach them to the meeting record. Meeting analytics show completion rates, overdue items, and participation trends to help managers reduce decision latency.
For regulated work, the assistant timestamps decisions and keeps an audit trail linked to project records. Organizations should require owner confirmation for high-impact tasks and enable status reminders until tasks close. Sentiment analysis can flag heated discussions for review, helping compliance teams spot risks without reading every transcript.
Security, Privacy, and Enterprise-Grade Protection
Enterprise adoption demands data controls, encryption, and admin oversight. Meeting assistants must offer end-to-end encryption, role-based access, and options for on-prem or regional data residency. Vendors like those integrated into major platforms provide enterprise-grade controls suitable for sensitive discussions.
Privacy best practices include clear consent banners, the ability to exclude recordings per meeting, and configurable retention policies. IT teams should verify SOC/ISO certifications and confirm third-party data processing terms. Strong logging and admin dashboards let security teams audit access and configuration changes.
by Melvin Halpito | Apr 21, 2026 | Article
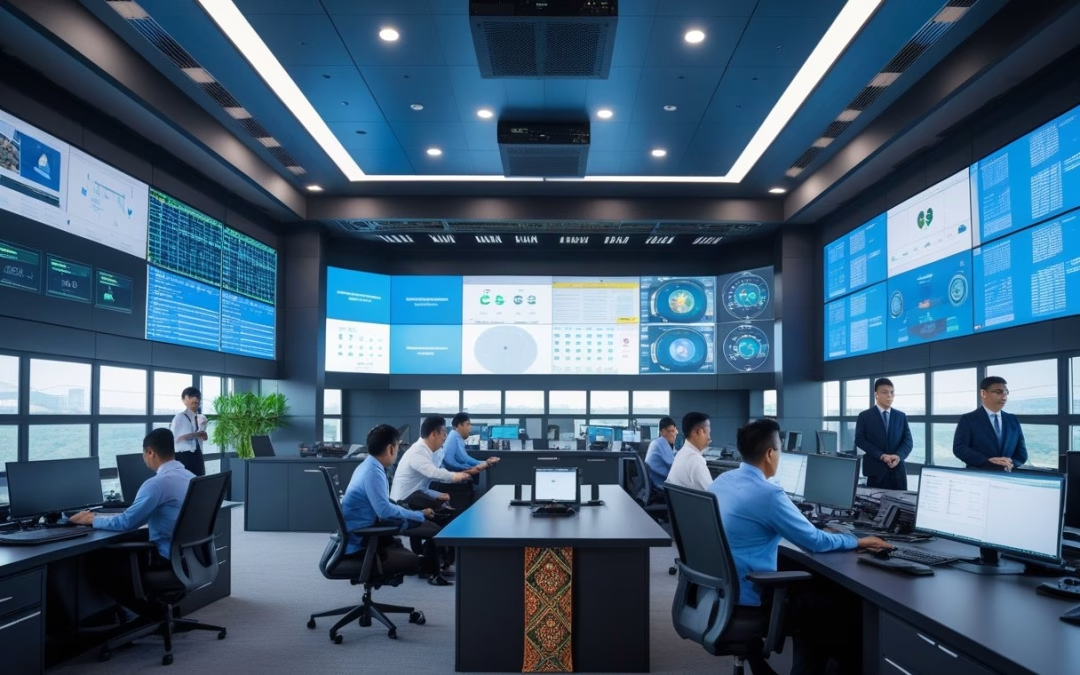
You will find a clear, engaging introduction below that follows your instructions. Command centers centralize monitoring, incident response, and communications into one staffed room or virtual hub. They combine data feeds, standard operating procedures, and trained operators to speed decisions and keep services running.
Role in Unifying Operations and Business Continuity
A command center (or pusat kendali) acts as the single point for operational visibility. It collects telemetry from IT systems, facilities, logistics, and field teams so operators can spot failures fast. For Indonesian corporates, that means linking regional office systems, cloud services, and on-premise sensors into one dashboard.
Staff follow clear playbooks for outages, supply-chain delays, and regulatory incidents. The command center coordinates resource shifts, invokes backup sites, and triggers vendor SLAs. This reduces mean time to recovery and keeps revenue lines and customer services active.
They also manage business continuity tests. Regular simulations validate recovery plans, update runbooks, and train people. That practice makes actual disruptions shorter and less costly.
Integration of Security, Monitoring, and Decision-Making
A control center must fuse security operations (SOC) with operations monitoring (NOC) so threats and faults are seen together. Correlating logs, CCTV feeds, and network alarms helps the team decide whether an event is cyber, physical, or both.
Technical stack typically includes SIEM, network monitoring, video management, and an incident management platform. Operators use correlation rules and playbooks to prioritize actions and escalate to executives when needed.
Physical security teams, IT, and third-party vendors share a common incident ticket. That single ticket holds timelines, decisions, and evidence for audits. For compliance in Indonesia, this integrated approach simplifies reporting to regulators and customers.
Unified Communications and Real-Time Collaboration
Unified communications (UC) links voice, chat, video, and alerting inside the pusat komando. Operators can call field staff, start a video briefing, and push notifications to affected users from one interface.
Real-time collaboration tools record decisions and annotate live dashboards. Role-based access controls let supervisors view the full picture while field technicians see only task lists. This reduces errors and cuts handover time.
Automated alerts and escalation chains ensure the right people respond. Integration with mobile apps lets remote teams receive tasks and upload photos, keeping incident records accurate and timely.
Relevant reading: “Tugas dan Cara Kerja Command Center” explains operational roles and monitoring practices used in modern command centers (https://ivosights.com/read/artikel/command-center-tugas-dan-cara-kerja).
Key Technologies and Best Practices for Deployment
This section highlights practical choices for space, hardware, and data tools that keep operations secure and fast. It focuses on physical setup, display and camera integration, and smart analytics to help teams act quickly and confidently.
Design, Layout, and Essential Infrastructure
They should start by mapping workflows to the room layout. Place operator stations so each team has direct sightlines to the video wall and to one another. Allow clear circulation paths for shift changes and equipment access.
Power and networking must include N+1 UPS for critical racks and redundant fiber or 10 Gbps links between core switches. Use separate VLANs for CCTV, corporate IT, and command-center systems to limit blast radius. Climate control should target 22–24°C with hot-aisle/cold-aisle rack arrangements.
Install ergonomic furniture and adjustable monitor arms to reduce fatigue. Include a secure equipment room for servers and a dedicated operations desk for incident leads. Plan for modular growth: floor boxes, extra fiber conduits, and power circuits to simplify future deployment.
Video Wall and CCTV Integration
Choose video wall panels with narrow bezels, 4K capability, and at least 500 cd/m² brightness for mixed indoor light. Use a matrix switcher or video-over-IP (SMPTE ST 2110 / NDI where applicable) to route sources dynamically. Ensure the videowall controller supports multi-window layouts and role-based display permissions.
For CCTV, prefer ONVIF-compliant cameras and VMS that support edge recording and health monitoring. Deploy separate storage tiers: short-term high IOPS for live feeds and long-term cold storage for compliance. Sync timestamps with NTP and a GPS or PTP clock to keep footage aligned.
Secure camera streams with TLS, camera password rotation, and network segmentation. Test latency end-to-end; keep one-way display latency under 200 ms for situational awareness. Document signal paths and label cables to speed troubleshooting during incidents.
Smart Data Analysis and AI-Driven Insights
They should integrate data from CCTV, access control, IDS/IPS, and business systems into a central platform with real-time dashboards. Use stream processing (Kafka, Flink, or similar) for event correlation and low-latency alerts. Define clear use cases first—e.g., perimeter breach detection, asset-tracking, or SLA monitoring—before adding AI.
Deploy AI models that match the use case: object detection for intrusion, OCR for plate reading, and anomaly detection for behavior changes. Validate models on local datasets to avoid false positives caused by local lighting or cultural patterns. Monitor model drift and set thresholds for human review.
Implement role-based alerts and automated playbooks for common events. Log all AI decisions and keep an audit trail to support investigations. For vendor tools and integration patterns, refer to design guides like PwC’s discussion on command center evolution for governance and maturity planning (https://www.pwc.com/m1/en/publications/documents/2024/reimagenaing-command-centres-of-the-future.pdf).
by Melvin Halpito | Apr 20, 2026 | Article
You want BYOD to feel familiar on any device while keeping data safe and private. Focus on platform‑agnostic workflows that standardize app access, authentication, and data handling so users get the same experience whether they use Android, iOS, Windows, or macOS. A clear, device‑neutral workflow reduces surprises, speeds user adoption, and limits security gaps without invading personal data.
They will learn simple steps to map business tasks into consistent flows, pick controls that work across platforms, and test UX quickly with real users. Practical guidance will show how to keep corporate data contained, meet compliance needs, and still let people work the way they prefer.
Key Takeaways
- Standardize workflows so work feels the same on every device.
- Choose controls that protect data without overreaching into personal use.
- Validate the approach with real user tests to catch issues early.
Enabling Platform‑Agnostic BYOD Workflows
This section explains concrete steps to run BYOD programs that work the same on phones, tablets, laptops, and cloud desktops. It focuses on architecture, UX consistency, and device management to reduce user friction and security gaps.
Architectural Evolution and Cross-Platform Compatibility
They move away from device-specific tooling toward services and APIs that run anywhere. Start by defining a backend of microservices and REST or gRPC APIs that deliver data and business logic independent of client OS. Use authentication via OAuth2/OpenID Connect and token-based access so apps don’t rely on device identity alone.
Adopt containerized or serverless components to scale per workload and keep client apps thin. Where edge processing matters, deploy small, platform-agnostic components (containers or wasm modules) that mirror cloud logic. Use standardized data formats (JSON, protobuf) and feature flags to enable or disable capabilities per device class.
Prioritize web-first or progressive web app approaches when native parity is unnecessary. When native is required, share core code with cross-platform frameworks and keep platform-specific layers minimal. This reduces testing effort and helps deliver a consistent feature set across BYOD devices.
Consistent User Experience Across Devices
They design UX with mobile-first, responsive patterns and clear interaction rules. Define a single design system (tokens, components, spacing, color) and ship it as reusable libraries for web, iOS, Android, and desktop frameworks. This ensures buttons, feedback, and error states behave and look the same.
Map workflows to device capabilities: fingerprint or Face ID where available, fall back to MFA otherwise. Use adaptive layouts: a two-column task view on laptops becomes a stacked single column on phones. Document exact breakpoints, input expectations, and accessibility rules so product and engineering implement consistent behavior.
Measure success with device-based KPIs: task completion time, error rates, and session dropoffs per form factor. Use analytics and remote session capture to find UX regressions on specific BYOD models and fix them quickly.
Unified Endpoint Management and Application Separation
They separate corporate apps and data from personal files using EMM/UEM controls and containerized app models. Enforce per-app VPN, managed browsers, and app-level encryption to keep enterprise traffic distinct. Use policies that apply to app containers rather than the whole device to respect privacy on personal BYOD devices.
Select a UEM that supports policy templates, conditional access, and automated compliance checks across platforms. Integrate UEM with identity providers so access depends on device posture, app integrity, and user risk scores. Automate remediation flows: quarantine noncompliant apps, prompt updates, or apply selective wipe to corporate containers.
Keep application management lightweight by delivering apps via app stores, enterprise catalogs, or progressive web apps. Use silent or staged updates for managed apps to reduce user disruption. Maintain clear user communications about what the organization controls and what remains private.
Balancing Security, Privacy, and Compliance in BYOD
Organizations must enforce least-privilege access, protect data on and off devices, and respect employee privacy while meeting laws like GDPR and industry rules. Practical controls include strong authentication, device posture checks, encryption, clear BYOD policies, and logs that feed incident response and compliance reviews.
Zero Trust and Access Control Strategies
They adopt Zero Trust to verify every access request by identity, device posture, and context. Start with multi-factor authentication (MFA) and single sign-on (SSO) tied to role-based access so finance, HR, and contractors get only the apps they need. Use conditional access to block or reduce access when the device fails posture checks — for example, outdated OS, missing disk encryption, or disabled antivirus.
Implement device compliance rules in the identity provider that map to MDM/endpoint management signals and EDR alerts. Enforce least privilege and just-in-time elevation for sensitive tasks via Privileged Access Management (PAM). Maintain audit logs of who accessed what app, from which device, and which posture checks passed to support incident response and compliance evidence.
Data Protection and Encryption Measures
They protect data in three places: at rest, in motion, and in use. Require device encryption (full-disk or OS-level) and encrypt TLS for all traffic to corporate apps. Use containerization or app-level encryption for corporate data on personal devices to separate personal files from corporate files and reduce leakage risk.
Deploy Data Loss Prevention (DLP) on the gateway and in cloud apps to block copy/paste, downloads, or uploads that violate policy. Combine DLP with conditional access so high-risk devices can access only web-based, read-only sessions. Plan EDR integration so endpoint telemetry can trigger automated isolation and revoke access when a breach or compromise appears. Keep encryption keys under organization control or managed by a trusted key service to protect data ownership and regulatory requirements.
Privacy Rights and Compliance Challenges
They write BYOD policies that state what is monitored, what stays private, and what data the company can access. Limit MDM scope on personal devices to posture checks, container control, and app-level management rather than full device wipes when possible. Offer clear consent and an appeal path for employees to protect employee privacy and reduce legal risk.
Align technical controls and logs with regulations like GDPR by minimizing retained personal data, scoping TLS inspection, and documenting legal bases for processing. Make incident response playbooks that separate personal data from corporate evidence and use standardized exports for auditors. Regularly review policy changes, retention periods, and third-party agreements to close compliance gaps and maintain trust.
by Melvin Halpito | Apr 20, 2026 | Article
You will find new ways to link MLV Teknologi with global OEMs to shift from selling hardware bundles to delivering complete, integrated workplace ecosystems. They show how combining systems, software, and services can cut friction, improve uptime, and make teams work smarter across locations.
This shift lets companies replace one-off devices with platforms that unite tools, data, and workflows so operations run smoother and costs drop. They can use modular designs, cloud services, and better supplier collaboration to scale faster and stay competitive.
Key Takeaways
- Companies gain operational consistency by moving to platform-based workplace solutions.
- Integrated systems reduce downtime and simplify maintenance across sites.
- Cloud, modular hardware, and connected services enable faster scaling and innovation.
From Hardware Bundles to Integrated Workplace Ecosystems
MLV Teknologi connects AV devices, room control, security, and displays into a single operational layer. The work focuses on integration, vendor partnerships, and services that turn stacked hardware into managed workplace functions.
MLV Teknologi’s System Integration Approach
MLV Teknologi acts as an AV system integrator that designs and builds complete installations. It teams with global OEMs and local partners to combine LED displays, video walls, conferencing gear, and control systems into one platform. Projects often include site surveys, room programming, cabling, and on-site commissioning.
They emphasize repeatable templates for meeting rooms, huddle spaces, and public areas. This lowers deployment time and reduces configuration errors. The company also offers training and aftercare so operations teams can manage devices and workflows without constant vendor intervention.
For customers, the benefit is predictable performance and a single vendor relationship for hardware, software, and services. MLV Teknologi lists its capabilities and projects on its site, which provides contact and location details for further inquiry (mlvteknologi.com).
The Shift Towards Smart Office Solutions
Organizations now demand systems that manage space, AV, and security together. Smart office solutions add sensors, room booking, and automated controls to traditional AV setups. This turns equipment bundles into services that schedule rooms, optimize energy use, and improve meeting experiences.
MLV Teknologi integrates Crestron or Extron control with displays from Planar and Samsung to enable centralized control and consistent user interfaces. Automation can pause AV sources, adjust lighting, or switch cameras based on meeting state. These workflows reduce meeting friction and support hybrid work patterns.
Decision makers value measurable outcomes: reduced idle rooms, faster meeting starts, and fewer helpdesk tickets. That makes investment in smart office systems easier to justify than buying isolated hardware items.
Role of Global OEMs in Ecosystem Transformation
Global OEMs like Extron, Crestron, Planar, and Samsung provide standardized, enterprise-grade components that system integrators use to build ecosystems. OEMs supply reliable hardware, developer APIs, and management tools that simplify large deployments and remote support.
They also offer certification, warranty, and software updates that protect long-term investments. MLV Teknologi partners with these OEMs to match product capabilities to client needs and to scale solutions across buildings. OEM collaboration helps with interoperability testing and creating design-and-build packages that speed procurement and installation.
Together, integrator and OEMs move clients from one-off hardware purchases to platforms that can be monitored, updated, and extended as workplace needs change. See reporting on MLV Teknologi’s OEM collaborations for examples of these partnerships in action (MLV Teknologi and Extron partnership).
Key Technologies Powering Modern Workplace Integration
These technologies connect displays, audio, sensors, and control systems into a single operational layer. They enable predictable meeting experiences, centralized monitoring, and data-driven room and building management.
AV System Integration and Digital Signage
AV system integration ties displays, video walls, and sound systems to a central control plane. It links interactive flat panels, LED displays, and videotron screens with video matrixing and signal management to deliver seamless presentations and branded digital signage.
For large venues, distributed AV over IP reduces cabling and simplifies signal routing. Matrix switchers, encoders/decoders, and networked media players handle multi-source distribution while preserving resolution and low latency.
Sound design matters: quality loudspeakers, ceiling arrays, and microphone systems—such as omnidirectional mics and noise-cancellation processors—ensure intelligible speech in hybrid meetings. Control systems standardize room presets, volume, and input switching through touch panels or mobile apps.
Integrators must plan infrastructure: rack space, power, cable pathways, and service access. MLV Teknologi’s work shows how integrated AV supports both corporate communications and public-facing displays like lobby video walls and wayfinding signage (see integration example).
Smart Meeting and Command Center Solutions
Smart meeting solutions combine room booking, sensor data, conferencing devices, and automations to reduce friction. A meeting room can auto-select camera presets, set lighting scenes, and route the correct AV source when a booking starts. Interactive whiteboards and collaboration displays sync content to cloud services for immediate sharing and archival.
Command centers consolidate CCTV feeds, analytics, and building sensors for situational awareness. Video walls and control-room processors present prioritized alerts, while access control and visitor systems feed security workflows. Integrated CCTV plus video analytics enables event detection and faster incident response.
Resilient network design, redundant display controllers, and clear operator interfaces matter most. Service-level agreements and on-site support keep critical rooms and command centers available.
Collaboration, Productivity, and Operational Efficiency
Collaboration tech pairs conferencing hardware with software services to improve remote teamwork and meeting outcomes. High-quality cameras, beamforming microphones, and echo-canceling audio increase meeting usability. Peripherals and room kits standardize the user experience across sites and reduce setup time.
Operational efficiency grows from sensor-driven space management. Occupancy sensors, desk booking platforms, and room analytics feed utilization dashboards so facilities teams can reassign space and cut costs. IoT integrations—HVAC triggers, lighting control, and automated room sanitization—tie operational systems to room state.
AI and analytics add value: meeting transcription, participant presence detection, and noise-level monitoring help optimize policies and equipment placement. Post-installation support, spare-part planning, and maintenance contracts ensure long-term performance for enterprise-scale AV and smart office deployments.
by Melvin Halpito | Apr 19, 2026 | Article
You step into a lobby, briefing center, or product theater and feel a message instead of just seeing one. AV design turns architecture into a storytelling, using light, sound, motion, and interactivity to make brand values immediate and memorable. When you place purposeful AV in these key spaces, you speed understanding, build trust, and make your brand easier to recall.
This article shows how to use AV in lobbies, briefing centers, and product theaters to shape perception and drive action. It explains what matters most—visual clarity, consistent narrative, and immersive interaction—and gives practical ideas you can apply to your own spaces to make every visit purposeful and persuasive.
Key Takeaways
- Use AV to communicate brand identity quickly and clearly.
- Design experiences that align visuals, sound, and interaction.
- Choose spaces that convert interest into meaningful engagement.
Core Principles of Brand Storytelling Through AV
Brand storytelling should guide visitor movement, reveal brand values, and create moments that build loyalty. AV design must map content to space, emotion, and brand identity to deliver clear, repeatable experiences.
Defining Brand Narrative in Physical Spaces
They must translate the brand story into a physical sequence of moments. Start by mapping the visitor journey: entry, focal points, decision spots, and exit. Place key brand messages at high-attention zones like lobby sightlines, briefing-center demo stations, and product-theater stages.
Use consistent visual and verbal cues: logo treatment, color palette, typography, and short taglines. Tie those cues to measurable goals such as recall, demo requests, or sales leads. Ensure architecture supports storytelling—sightlines, acoustics, and lighting should guide attention to narrative beats.
Align every AV asset with brand positioning and values. Avoid generic stock content; use bespoke visuals and real customer stories to strengthen brand identity and consumer engagement.
Emotional Connection and Brand Experience
They must design AV to trigger specific emotions tied to brand values. Identify the desired feeling—trust, excitement, or comfort—and craft audio, pacing, and imagery to elicit it. For example, a briefing center aiming for trust uses calm lighting, slower cuts, and testimonial audio.
Use human voices and real-world footage to increase authenticity. Music and voiceover should match the emotional arc: tension at challenge points, resolution when the product solves a problem. Small tactile or scent cues in lobbies can reinforce the on-screen message and deepen emotional impact.
Measure emotional outcomes with simple metrics: dwell time, repeat visits, and qualitative feedback from guided tours. These link emotional connection to brand loyalty and long-term customer experience.
Multisensory Engagement with AV Technology
They must layer sight, sound, and motion to make stories immersive without overwhelming visitors. Combine high-quality displays with directional audio and subtle motion (kinetic walls, moving light) to focus attention. Use interactive touchpoints in product theaters so visitors can control pacing and explore features.
Optimize AV for clarity: readable on-screen text, consistent audio levels, and lighting that prevents glare. Integrate sensors and content scheduling so experiences change by time of day or audience size. That adaptability supports multipurpose spaces and keeps the brand experience fresh.
Balance novelty with purpose. Every multisensory element should reinforce the brand narrative and drive consumer engagement toward a clear action, like signing up for a demo or visiting a product table.
AV-Driven Immersive Environments: Lobbies, Briefing Centers, and Product Theaters
These spaces use visual and audio technology to shape first impressions, explain complex ideas, and showcase products in motion. They rely on integrated AV systems, adaptable room elements, and content that responds to visitors to deliver clear, memorable brand messages.
Interactive Displays and Digital Signage in Lobbies
Lobbies act as the brand’s open door. They pair large-format digital signage, touch-enabled kiosks, and smart mirrors to greet visitors with tailored content. Displays can show live building wayfinding, event schedules, or personalized welcome messages pulled from CRM systems.
Designers should specify energy-efficient displays and smart lighting systems that dim or color-shift with content to save power and match brand tones. Remote monitoring lets facilities staff check screen health and content playback without onsite visits.
Practical layout tools include retractable screens and movable walls that reconfigure the lobby for events or quiet waiting areas. Operators often combine static hardware with cloud-based content managers so teams update messaging centrally and push regional variations fast.
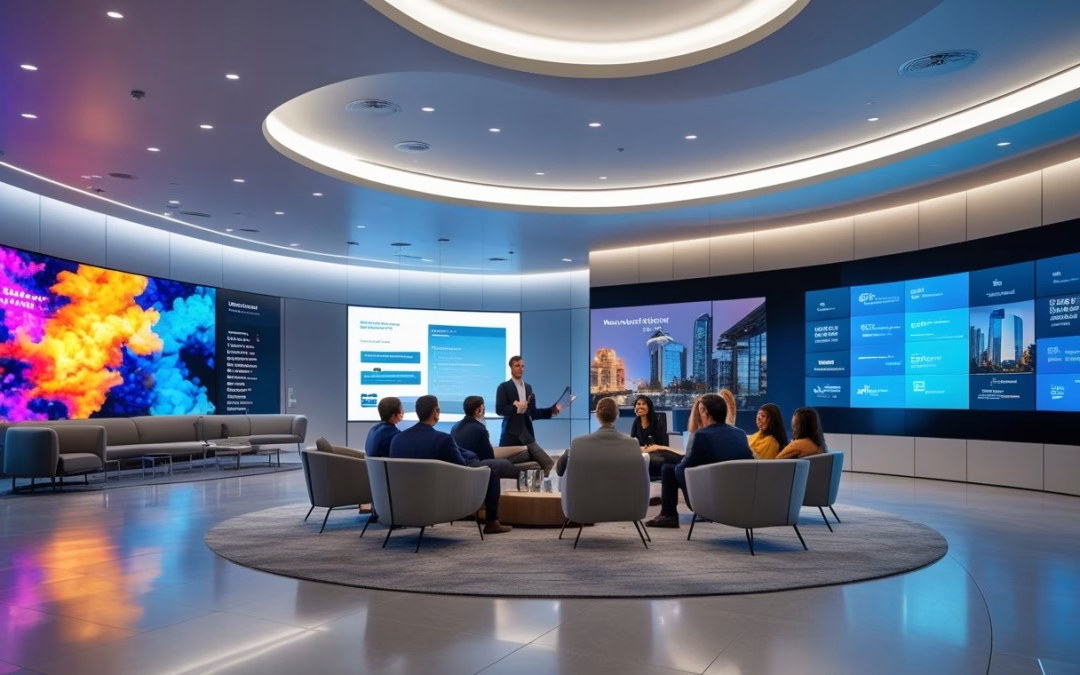
Immersive Storytelling in Briefing Centers
Briefing centers convert complex services into tangible experiences using immersive soundscapes, high-resolution projection, and architectural design integration. They use spatial audio and synchronized lighting cues to guide attention and create emotional context for technical demos.
Interactive elements—AR stations, interactive displays, and multi-touch tables—let visitors explore scenarios and data at their own pace. Multipurpose spaces use retractable screens and movable walls so one room supports a demo, a hands-on workshop, or a formal presentation.
Data-driven personalization improves engagement. Systems read visitor intent from registrations and present tailored sequences. Facilities integrate dynamic AV systems with building controls to adjust HVAC and lighting for comfort while keeping energy-efficient building goals in mind.
Product Theaters: Dynamic Brand Showcases
Product theaters stage products with timed lighting, projection mapping, and integrated sound to show features in real conditions. They combine demo pods, immersive projection, and live operator stations so staff switch between guided tours and self-led exploration.
Architectural design and AV technology merge to hide speakers, projectors, and cables for a seamless look. Movable staging and retractable screens let teams swap demos quickly between sessions and adapt theater size for audiences.
Operators use analytics from interactive displays and sensors to measure dwell time and interaction rates. This data feeds content loops and schedules, helping teams refine experiences and prove the theater’s impact on customer engagement.


Recent Comments