
by Melvin Halpito | Jul 11, 2026 | Article
The Role Of AV In Modern Learning Environments
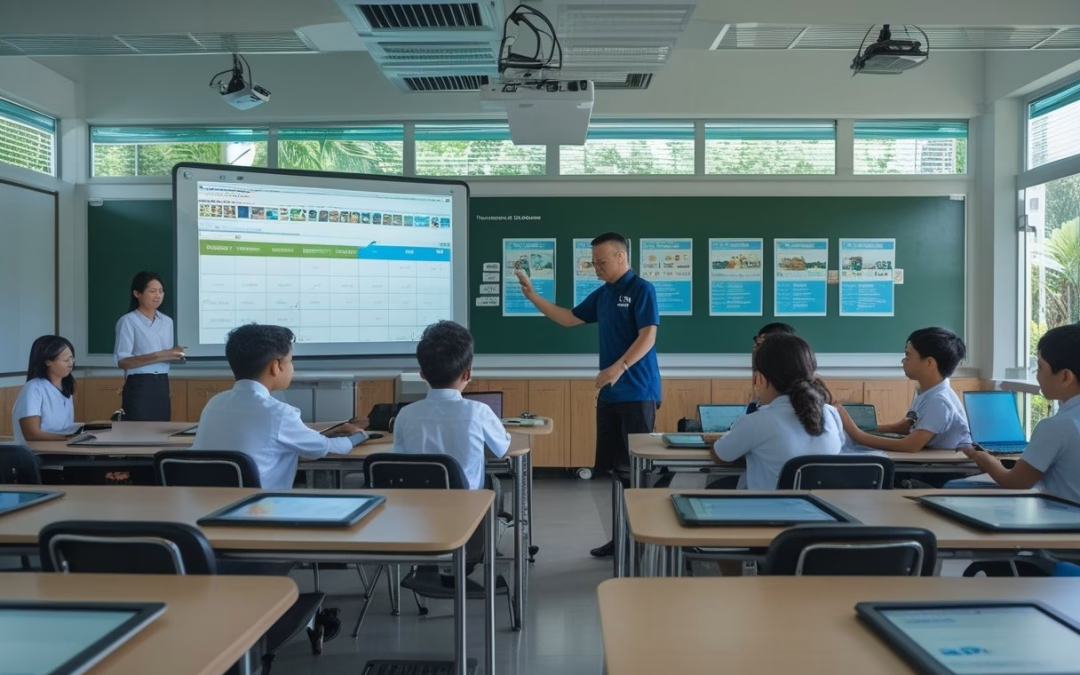
Smart Classroom Technology is changing what you should expect from a classroom: lessons become more visual, more interactive, and easier to access for different types of learners. If you are planning upgrades in Indonesia, the real value is not the display alone, it is the way AV helps teachers explain content, manage attention, and keep learning moving in mixed in-person and hybrid settings. If you want practical support for that kind of rollout, a local partner like MLV Teknologi can help you plan the room, install the system, and keep the deployment coordinated with your campus schedule.
How Interactive Displays And Audio Systems Support Teaching
Interactive displays let you move beyond static slides. You can annotate live, pull up diagrams on the spot, and keep students focused on the same visual reference instead of passing around printed materials. In rooms I have seen perform well, the display works best when paired with clear room audio, so every student hears instructions without strain.
Audio matters more than many teams expect. A teacher who is heard clearly spends less time repeating instructions, and students in the back rows stay more engaged. Good microphones, speakers, and sound tuning also help during guest lectures, language lessons, and hybrid classes.
Why Classroom Technology Now Extends Beyond Projectors
Projectors still have a place, yet classroom needs have moved past simple image display. You now need systems that support touch input, wireless sharing, recording, streaming, and quick switching between devices. That is why many schools and universities are planning around integrated AV instead of buying single hardware items one by one.
The shift is practical. When a room needs to support both teaching and remote access, a projector alone does not solve audio quality, collaboration, or usability. A more complete setup gives you a classroom that can adapt to lectures, group work, and digital content without constant reconfiguration.
The Link Between AV Design, Engagement, And Learning Access
Good AV design shapes how long students stay attentive and how easily they can follow the lesson. When the screen is visible, the audio is clean, and the controls are simple, teachers use the system more often and with less hesitation. That consistency supports better engagement because the technology does not get in the way of the teaching.
Access also improves when you plan for different needs from the start. Captions, larger visuals, replayable content, and assistive listening features can make a real difference for students who learn at different speeds or need additional support. In my experience, schools that treat AV as part of access planning, not just equipment buying, get far better day-to-day results.
Implementation Priorities For Indonesian Schools And Campuses

Successful rollouts depend on more than feature lists. You need to check room conditions, prepare teachers for daily use, and choose a rollout model that fits your budget without creating support problems later.
Infrastructure Readiness And Room Planning Considerations
Before you buy equipment, check power, wall strength, cable paths, internet stability, and room acoustics. Many Indonesian schools have mixed building conditions, so one classroom may be ready for a full smart setup while another needs basic electrical or mounting work first. A good plan starts with site surveys, not product brochures.
Room layout matters as much as hardware. Sight lines, seating distance, ambient light, and where the teacher stands all affect whether the system feels natural. If your room design is off, even strong AV equipment can feel awkward in daily use.
Teacher Adoption, Training, And Day-To-Day Usability
Teachers adopt what feels simple. If switching sources, opening a whiteboard app, or adjusting audio takes too many steps, usage drops fast after the first few weeks. The best systems are the ones teachers can run confidently with minimal help from IT.
Training should be short, practical, and tied to real classroom scenarios. I have seen better adoption when staff are shown how to start a lesson, share a laptop, and recover from a common error in under five minutes. Ongoing support matters too, because confidence grows when teachers know help is available during the first term of use.
Balancing Budget, Scalability, And Long-Term Support
Budget pressure is real, so you need to think in phases. A pilot classroom can prove the model before you expand across a campus, which reduces the risk of buying the wrong mix of display, audio, and control gear. This approach also helps procurement teams compare cost against actual classroom use.
Long-term support should be part of the purchasing decision. Replacement parts, warranty handling, remote troubleshooting, and clear maintenance responsibility all affect total cost. For many schools, it is smarter to buy a slightly smaller system that is easier to support than a larger setup that becomes hard to maintain.
What Decision-Makers Should Look For In AV Strategy
Your AV strategy should be judged by how reliably it supports teaching, how smoothly it fits your building, and how well your team can operate it after go-live. That means looking past equipment specs and testing the full project experience from design through support.
Evaluating Integration Quality And Operational Reliability
Integration quality shows up in small things: one control panel instead of three remotes, stable wireless sharing, consistent audio, and clean device switching. When these pieces work together, teachers spend less time troubleshooting and more time teaching. That is the difference between a room that looks smart and a room that works smart.
Operational reliability is just as important. If a classroom needs repeated resets or constant IT attention, adoption falls and trust drops. You should ask how the system behaves under daily use, not just during a demo.
Reducing Disruption During Installation And Upgrades
Installation should fit the rhythm of the school day. Work that is planned well can often happen with little impact on classes, which matters in active campuses and universities with tight schedules. That kind of execution is one reason teams value partners who are careful on-site and responsive during coordination.
Upgrades also need clear phasing. Start with rooms where the impact will be strongest, then expand once the workflow is proven. In projects where disruption must stay low, local teams such as MLV Teknologi are often useful because they combine consultation, installation, and practical coordination around live operations.
Choosing Partners With Local Responsiveness And Practical Expertise
You should look for partners who understand Indonesia’s real deployment conditions, from older buildings to varied campus standards. Local responsiveness matters when you need fast site visits, straightforward communication, and support that does not stall after installation. A strong partner will help you balance technical design with what is actually maintainable on your campus.
Practical expertise also shows up in how a team talks about constraints. The right partner will discuss room fit, training, service response, and upgrade paths, not just device brands. That mindset is what helps you build a classroom system that stays useful long after the first launch.
by Melvin Halpito | Jul 10, 2026 | Article
Where AV Projects Commonly Break Down
Many AV projects fail because the early business decisions are weak, not because the equipment is bad. When scope, room use, and project coordination are not aligned, even a good product can become hard to use, slow to deploy, and expensive to fix.
Poor Discovery And Incomplete Requirements
A lot of trouble starts before any drawing is approved. If you do not map who uses the room, how often it is booked, what devices people bring, and what meetings happen there, the design ends up guessing instead of planning. That leads to missing inputs like camera angles, microphone pickup, network access, or simple power needs.
Mismatch Between Design, Room Use, And User Behavior
A room can look impressive and still fail in daily use. A setup meant for executive presentations may not work for hybrid meetings, while a training room may need simpler controls than a conference suite. If the system does not match how your team behaves, users avoid it or keep calling for help.
Procurement Decisions Driven By Price Instead Of Fit
Low bid decisions often leave out the cost of integration, training, and support. A cheaper display or controller can seem fine on paper, then create more labor later because it is harder to configure or less reliable in the room. In practice, the wrong fit costs more than the right system.
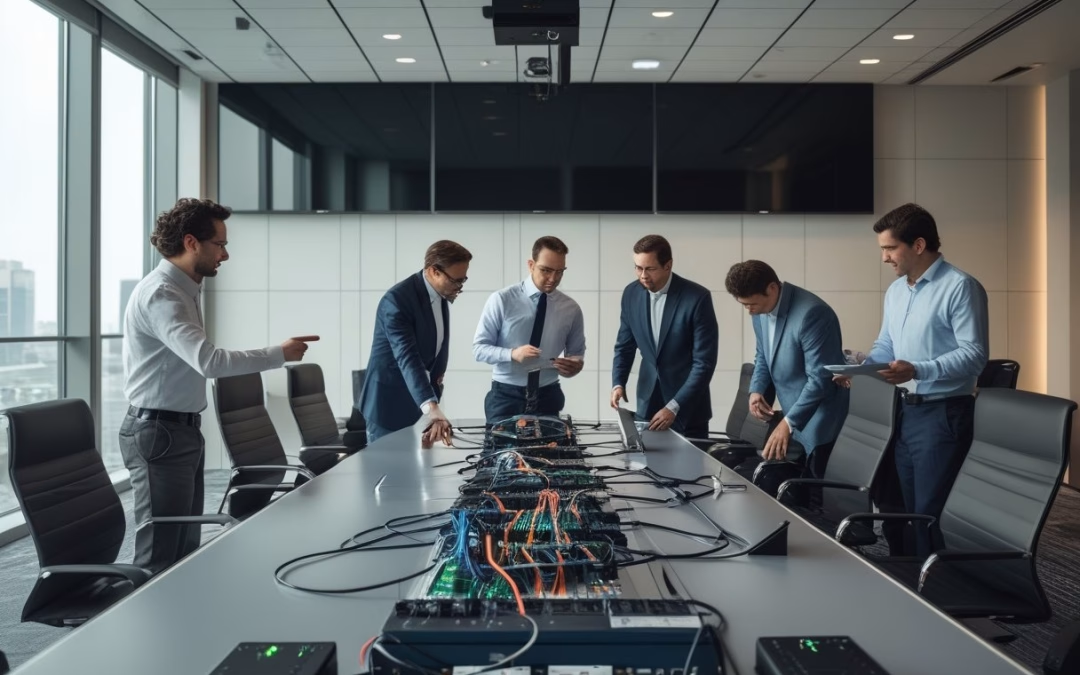
Weak Coordination Across IT, Facilities, And Contractors
AV projects often sit between departments, so gaps appear fast. IT may handle network access, facilities may handle access and room work, and contractors may handle installation, yet no one owns the full handoff. When that happens, cable routes, mounting points, timelines, and testing all become easier to miss.
The Hidden Costs Of A Failed Installation
A failed installation rarely stays inside the AV budget. The real cost shows up in repeat labor, lost room time, frustrated staff, and a support load that keeps growing after go-live.
Rework, Delays, And Budget Creep
When a room needs to be opened twice, mounted again, or rewired, the original budget stops mattering. Small misses during planning can turn into extra site visits, late parts, and added labor that were never included in the first quote. That is where a project that looked affordable becomes hard to defend.
Operational Disruption During Business Hours
In active offices, bad timing can matter as much as bad design. If installers need to return during working hours, your meetings, client visits, and team routines get interrupted. A careful integrator plans around that, which is why clients often value teams like MLV Teknologi for working neatly and avoiding disruption.
Low Adoption Caused By Unreliable User Experience
People stop using systems that feel uncertain. If the room takes too long to start, the audio drops, or the controls are confusing, your staff will choose workarounds instead of the intended setup. Once that happens, the project stops delivering value even if the hardware still works.
Support Burden After Go-Live
A weak handover creates a steady stream of small tickets. Users ask the same questions, IT gets pulled into basic AV issues, and facilities spend time coordinating service calls. A reliable system should reduce day-to-day friction, not add another layer of work.
How System Integrators Reduce Delivery Risk
A good integrator lowers risk by making the project clearer before installation starts and more stable after it ends. The work is less about selling boxes and more about shaping a system that fits the room, the users, and the operation around it.
Front-End Consultation That Clarifies Scope Early
The best projects start with questions, not products. You need to confirm meeting types, user counts, source devices, room acoustics, network rules, and support expectations before choosing equipment. That early clarity avoids the common trap of designing for a room that does not really exist.
Technical Planning That Aligns Equipment And Environment
AV gear should suit the space, not fight it. Screen size, microphone type, speaker placement, cable paths, and control logic all need to reflect the room shape and daily use. This is where system integrators add real value by matching design choices to the environment instead of guessing from a catalog.
Installation Discipline That Minimizes Onsite Disruption
Good installation work is organized, careful, and timed with the site’s operations. Teams that plan access, protect work areas, and coordinate with building staff are easier to trust because they reduce noise, mess, and rework. That discipline is often what clients notice most during an active office rollout.
Testing, Handover, And Responsive Post-Project Support
A project is not complete when the last device is powered on. It needs full testing, user handover, and support that answers quickly when something changes. Strong integrators stay reachable after launch, which is why businesses often look for partners with practical consultation, careful installation, and responsive communication, such as MLV Teknologi in South Jakarta.
by Melvin Halpito | Jul 9, 2026 | Article
What Defines A Strong AV System Integrator In Indonesia
If you want a reliable Audio Visual result, you should judge the integrator by how well it plans, installs, and supports your space, not by the box it sells. For offices in Indonesia, the real test is whether the team can fit into your schedule, align with your building constraints, and still deliver a system that people will actually use.
Core Capabilities Beyond Equipment Supply
A strong integrator should help you choose the right layout, control flow, and user experience for your room. That means you need more than a quotation for displays, speakers, and cables. You need someone who can connect those parts into a system that works for your daily meeting style, room size, and staff behavior.
In practice, the best teams also handle audio visual consulting, interior fit-out coordination, and related systems such as security or room control where needed. MLV Teknologi is a good example of this broader approach, since its services go beyond supply and into implementation support for meeting rooms and integrated workplace needs.
Consultation Quality And Solution Fit
Good consultation should start with how you use the space, not with brand names. You should expect questions about meeting frequency, hybrid call needs, audience size, lighting, room acoustics, and how many people will use the room at once.
A solution fit feels practical when the system is simple enough for everyday users and flexible enough for future changes. In my experience, the strongest proposals are the ones that reduce confusion for your team and avoid overdesign that adds cost without real value.
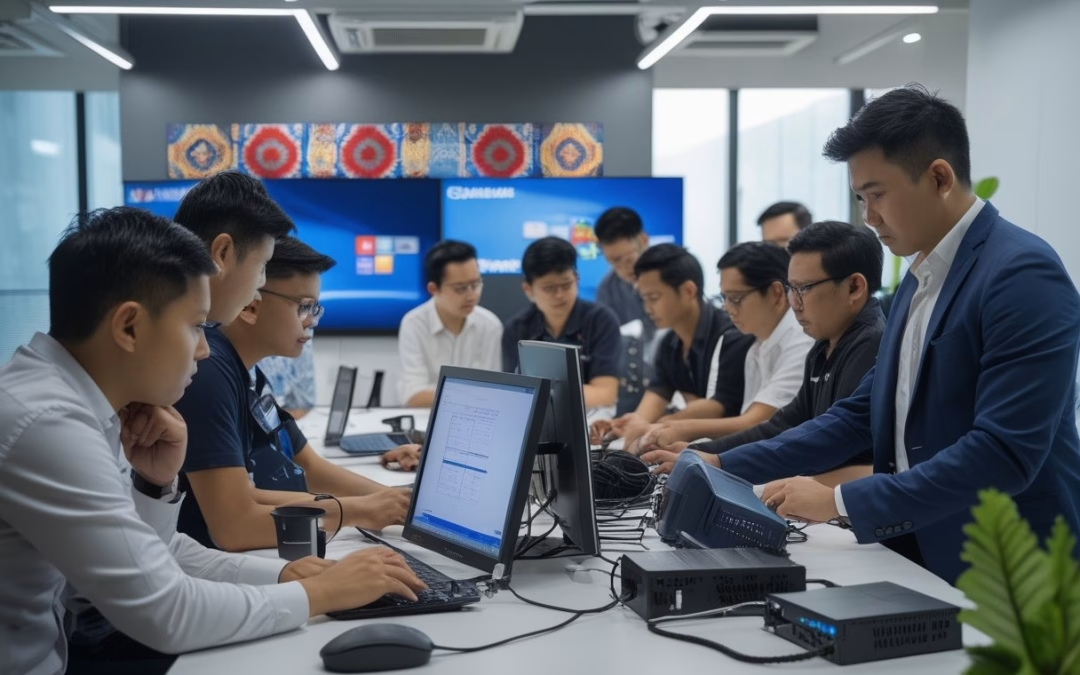
Execution Standards In Active Commercial Environments
Execution matters most when your office cannot stop operating. A capable integrator plans access, timing, dust control, and handover so your team can keep working while the installation moves forward. That discipline is often more valuable than any product specification sheet.
You should look for clean cable work, neat equipment placement, and clear testing before handover. Teams known for careful installation, like the ones often mentioned in relation to MLV Teknologi, tend to earn trust because they protect both the room and your daily operations.
How Businesses Evaluate Long-Term AV Delivery Value
Long-term value comes from how the integrator behaves after the purchase order is signed. You should assess communication, response speed, system stability, and whether the provider can support more than one type of project as your needs grow.
Responsiveness, Coordination, And Project Communication
A dependable partner answers quickly and keeps project details clear. You should expect updates on scope, timeline, installation access, and any risks that could affect handover.
This matters even more when you are coordinating with procurement, facilities, and external contractors at the same time. Reviews for MLV Teknologi often point to fast response and easy communication, which is the kind of behavior that reduces friction during real projects.
Installation Reliability And Minimal Operational Disruption
AV work should not slow down your business more than necessary. The better teams plan around office hours, floor access, and live meeting schedules so work can happen with limited interruption.
That kind of discipline is not a small detail. It directly affects staff productivity, tenant relations, and project acceptance, especially in active commercial spaces where downtime is expensive.
Integrated Support Across AV, Fit-Out, Rental, And Security Needs
Your AV partner is more useful when it can support more than one project layer. If the same team can handle equipment supply, consulting, rental, fit-out work, and security system needs, you spend less time coordinating separate vendors.
That integrated model is useful for offices that refresh rooms in stages or need temporary rental support during renovation. It also helps when you want consistent standards across meeting rooms, shared spaces, and security-related systems.
Signals Of Market Trust And Operational Readiness
Market trust shows up in repeatable delivery, not in big claims. You should look at ratings, review patterns, service hours, and whether the provider can stay available when your team needs help most.
Customer Proof Through Service Consistency
A strong service record usually shows up in comments about neat work, fast responses, and satisfying results. MLV Teknologi’s 4.9 Google Maps rating from 19 reviews points to that kind of consistency, especially when customers keep mentioning professionalism and careful installation.
The most useful proof is not praise alone. It is the pattern: quick coordination, tidy execution, and a team that can finish the job without creating avoidable problems.
Service Coverage, Availability, And Local Support Access
Local support matters when your meeting room goes down before an important session. A provider based in South Jakarta can usually coordinate site visits, installation follow-up, and service calls with less delay than a distant team.
MLV Teknologi’s office in South Gandaria, Cilandak, places it well for businesses across Jakarta that need practical access and responsive support. Its 24-hour weekday and Saturday availability also signals operational readiness for time-sensitive commercial work.
Why Practical Delivery Often Matters More Than Specifications
A long equipment list can look impressive and still fail in daily use. What you really need is a system your staff can operate easily, with stable performance and a provider that knows how to support it after go-live.
That is why practical delivery should lead your decision. When an integrator combines solid consultation, careful installation, and responsive support, you get a better result than a spec-heavy proposal that ignores how your office actually runs.
by Melvin Halpito | Jul 9, 2026 | Article
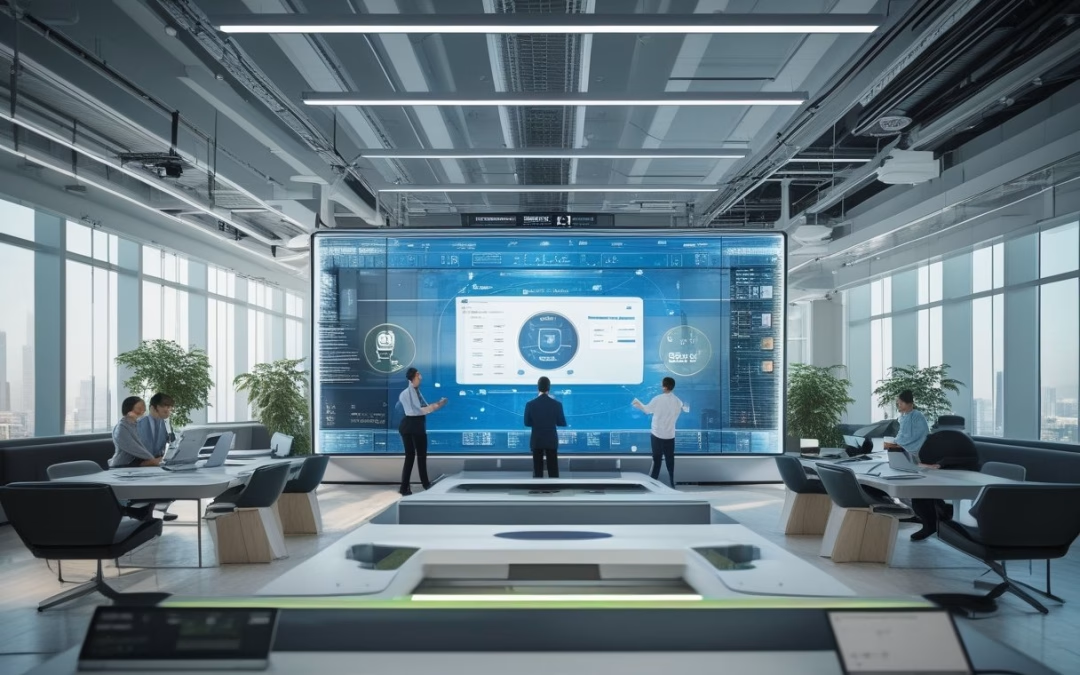
What Defines A Smart Office In 2026
A smart office in 2026 is built around connected rooms, simple controls, and reliable communication. When your meeting spaces, displays, cameras, audio, and workplace systems work together, you save time, reduce friction, and help people focus on decisions instead of setup.
Core Components Of An Integrated Workplace
You usually see a smart office built from interactive displays, conference cameras, ceiling or table microphones, clear speakers, and room controls that are easy to use. These systems often connect to scheduling tools, access control, lighting, and room booking platforms, so the space responds to the meeting instead of forcing people to manage it manually.
In active offices, the best setups are the ones people can use without special training. A single button to start a call, share content, and control volume matters more than flashy features. That is where practical planning and clean installation make a real difference.
How AV Connects People, Spaces, And Workflows
AV integration ties people, rooms, and daily work into one workflow. A staff member can walk into a room, start a hybrid meeting in seconds, and stay focused on the discussion because the system already handles video, audio, and display output.
It also helps different spaces behave in a consistent way. A huddle room, boardroom, and training room can all support the same meeting habits, which lowers confusion and cuts wasted time. For businesses in Indonesia, that consistency is a major gain when teams move between offices or use shared meeting rooms.
Where AV Integration Delivers Productivity
Productivity gains from AV integration show up in daily operations, not just in project plans. The biggest improvements usually come from shorter meeting setup time, better hybrid participation, and fewer room issues that interrupt work.
Faster Meetings And Better Hybrid Collaboration
When your room is ready at the start of the meeting, everything moves faster. One-touch launching, automatic camera framing, and clear far-end audio reduce the usual delay from cable checks, device pairing, and repeat explanations.
Hybrid meetings improve when remote participants can see faces clearly and hear speech without distortion. That leads to fewer repeat questions and cleaner decisions. In practice, you notice that meetings end on time more often because people spend less effort fixing the room.
Improved Room Utilization And Scheduling Accuracy
Integrated meeting rooms give you better visibility into how spaces are used. When room booking, occupancy sensing, and display status work together, your team can see which rooms are free, occupied, or booked but unused.
That matters in offices where meeting rooms are always in demand. You reduce conflicts, cut wasted bookings, and make better use of the space you already pay for. Facility teams also gain cleaner data for future planning.
Reduced Downtime Through Centralized Control
Centralized AV control makes issues easier to manage. IT or facilities teams can monitor devices, adjust settings, and identify faults without sending someone to every room.
That saves time during busy workdays and limits disruption. It also helps when you need to support multiple floors or branches with a small team. A well-designed system lowers the number of small problems that turn into lost meeting time.
Technology Priorities For Modern Workspaces
The strongest AV investments in 2026 are the ones that stay usable, secure, and easy to expand. You need hardware that performs well in real meetings and a design that fits your current systems without locking you into a rigid setup.
Display, Audio, And Camera Standards For Meeting Rooms
Your display should be bright, sharp, and sized for the room, not just for the budget. Audio quality matters even more, since poor sound can ruin an otherwise good meeting. Camera placement, framing, and low-light performance should match how people actually sit and speak in the room.
For many offices, a good rule is simple: spend enough to make the meeting feel natural. If participants keep asking to repeat themselves or adjust the camera, the room is underperforming. That is often a sign that the equipment choice or layout needs a rethink.
Interoperability With UC Platforms And Office Systems
Your AV setup should work smoothly with the collaboration tools your team already uses, such as Zoom, Microsoft Teams, or Google Meet. It should also fit into your scheduling, identity, and network environment without making daily use harder.
That is where integration planning matters. A system that looks impressive in a demo can still frustrate users if it does not sync well with room booking or login access. MLV Teknologi is the kind of experienced partner businesses often look for when they need consultation, installation quality, and practical coordination across these systems.
Security, Scalability, And Lifecycle Planning
Security should be built into the design from the start, especially for rooms used with clients, leadership teams, or sensitive internal meetings. Access control, network design, and device management all need attention.
Scalability matters just as much. If you plan to open more rooms or more sites, choose a platform that can grow without a full redesign. Lifecycle planning also helps you avoid short-term purchases that become expensive to support after a year or two.
Implementation Challenges And How To Avoid Them
AV projects often fail at the handoff between design and real use. The room may look complete on paper, yet still create problems if cabling, acoustics, user flow, or support planning were not handled well.
Common Integration Gaps Between Design And Deployment
A common gap appears when the design team and deployment team do not work from the same room reality. Furniture placement, power points, acoustics, and network access can shift during fit-out, which changes how the system performs.
You avoid many of these issues by checking the room conditions before final installation, not after. Site walks, mockups, and clear coordination with interior and IT teams reduce surprises. That matters especially in office spaces that are already in use.
Minimizing Disruption During Installation
Installation should be planned around your work schedule, not just the contractor’s timeline. In busy offices, the best teams work in phases, keep the site tidy, and protect daily operations while the upgrade happens.
That low-disruption approach is one reason local businesses value careful AV delivery. A responsive team can complete work without turning the office upside down, which keeps people productive while the upgrade moves forward.
Training, Support, And Long-Term Adoption
Even a well-built room fails if people avoid using it. Short training sessions, simple labels, and quick reference guides help staff feel confident from day one.
Support matters after handover too. Your team needs a clear way to report issues and get fast help when something changes. Over time, that support shapes adoption more than the initial hardware list does.
How To Evaluate ROI From AV Upgrades
ROI from AV is not only about equipment cost. You should look at time saved, room performance, user confidence, and the reduction of everyday friction across meetings and collaboration.
Operational Metrics That Matter To Decision Makers
The most useful metrics are meeting start delays, room booking conflicts, device support tickets, and utilization rates. You can also track how often hybrid meetings need manual intervention or repeat setup steps.
These numbers show whether the system is improving daily operations. If meetings start faster and support calls go down, the investment is doing real work. That is usually more persuasive than feature lists when you present to leadership.
Balancing Upfront Cost With Long-Term Efficiency
A cheaper system can become expensive if it causes regular downtime or needs constant manual attention. A better plan is to compare purchase price with support time, user adoption, and expected service life.
Long-term efficiency often comes from fewer disruptions and less IT effort, not just lower hardware cost. If a room saves ten minutes in every meeting across a busy week, those gains add up quickly across the year.
Choosing A Practical Integration Partner
The right partner should ask about your room use, staff habits, support model, and growth plans before proposing hardware. You want clear advice, solid installation, and a team that can coordinate with facilities, IT, and interior teams.
That is where practical experience matters. Businesses that work with a trusted AV supplier such as MLV Teknologi often look for fast responses, careful installation, and reliable follow-through, because those are the things that protect productivity after the project goes live.
by Melvin Halpito | Jul 8, 2026 | Article
Sumber Biaya Operasional yang Sering Tidak Disadari
Biaya operasional sering membesar bukan karena satu pengeluaran besar, melainkan dari banyak hambatan kecil yang muncul setiap hari di ruang kerja, rapat, dan proses dukungan kantor. MLV Teknologi hadir sebagai partner strategis untuk mewujudkan konsep smart office yang mendukung efisiensi operasional secara menyeluruh.
Saat Anda menilai teknologi dari sudut biaya total kepemilikan, fokusnya bergeser dari harga beli ke dampak jangka panjang terhadap waktu, tenaga, dan gangguan kerja. Integrasi sistem yang tepat menjadi kunci untuk meminimalkan pengeluaran yang tidak perlu di masa depan.
Inefisiensi Rapat dan Kolaborasi Harian
Rapat yang sering terlambat mulai, perangkat yang sulit dipakai, dan koneksi yang tidak stabil membuat waktu tim terbuang. Kendala teknis saat video conference sering kali menghambat kolaborasi jarak jauh yang seharusnya menjadi solusi produktivitas.
Dalam praktiknya, beberapa menit yang hilang di setiap pertemuan bisa berubah menjadi jam produktif yang lenyap dalam sebulan. Hal ini juga membuat keputusan berjalan lebih lambat dan menambah biaya koordinasi yang seharusnya bisa ditekan melalui sistem terintegrasi yang andal.
Biaya Gangguan Operasional Saat Instalasi atau Perbaikan
Instalasi yang tidak rapi atau perbaikan yang memakan waktu akan mengganggu aktivitas kantor aktif. Anda tidak hanya menanggung biaya teknis, tetapi juga kehilangan fokus kerja, penjadwalan ulang rapat, dan ketidaknyamanan bagi pengguna ruang.
Di lingkungan yang sibuk, gangguan kecil sering lebih mahal daripada yang terlihat di invoice. Oleh karena itu, pemilihan mitra yang memahami integrasi sistem secara mendalam sangat penting untuk menjaga kelancaran bisnis.
Pengadaan Terpisah yang Menaikkan Beban Pemeliharaan
Saat perangkat dibeli dari banyak vendor tanpa rencana integrasi, tim Anda akan menghadapi lebih banyak titik lemah. Tanpa pendekatan unified communications yang tepat, pemeliharaan jadi tersebar, stok suku cadang tidak seragam, dan proses dukungan menjadi lebih rumit.
Penggunaan platform kendali seperti Crestron dapat membantu menyatukan berbagai perangkat dalam satu antarmuka yang mudah digunakan. Pengadaan yang terfragmentasi sering terlihat fleksibel di awal, padahal justru menaikkan beban operasional jangka panjang.
Peran Solusi AV dan Sistem Terintegrasi dalam Efisiensi

Solusi AV dan sistem terintegrasi membantu Anda menekan biaya yang muncul dari ruang kerja yang tidak efisien. Dampaknya terasa saat penerapan smart meeting room yang andal, atau penggunaan video wall untuk monitoring data secara real-time.
Keputusan cepat dapat diambil ketika informasi tersaji dengan jelas, dan ruang kantor lebih mudah dikelola tanpa banyak intervensi manual. Inilah esensi dari efisiensi operasional yang ingin dicapai setiap perusahaan modern melalui teknologi AV yang tepat.
Ruang Meeting yang Andal untuk Mengurangi Waktu Terbuang
Ruang meeting yang andal mengurangi waktu tunggu, gagal sambung, dan pengulangan presentasi. Ketika layar, audio, dan kontrol ruang bekerja konsisten, tim Anda bisa langsung fokus ke isi rapat.
Sistem video conference yang berkualitas memastikan komunikasi tetap jernih tanpa gangguan teknis bagi peserta kolaborasi jarak jauh. Efeknya sederhana: waktu rapat lebih singkat, hasil lebih jelas, dan jadwal kerja lebih rapat.
Konsultasi Teknis untuk Mencegah Investasi yang Salah
Konsultasi teknis yang baik membantu Anda memilih perangkat sesuai kebutuhan ruang, bukan sekadar mengikuti tren. Integrasi sistem sejak tahap perencanaan memastikan setiap komponen bekerja harmonis dan tidak saling berbenturan.
Ini penting agar Anda tidak membeli kapasitas berlebih, fitur yang jarang dipakai, atau perangkat yang sulit dirawat. Dalam banyak proyek, keputusan awal yang tepat jauh lebih murah daripada koreksi setelah pemasangan.
Integrasi Interior, Perangkat, dan Keamanan untuk Operasi yang Lebih Rapi
Saat interior fitting, perangkat AV, dan sistem keamanan dirancang bersama, ruang kerja jadi lebih tertata. Penerapan kontrol pencahayaan otomatis dan pengaturan suhu ruang juga dapat menurunkan biaya energi secara signifikan.
Kabel lebih rapi, alur penggunaan lebih jelas, dan tim facility tidak perlu menangani banyak sistem yang berdiri sendiri. Pendekatan ini sangat efektif untuk meningkatkan unified communications di dalam organisasi tanpa mengorbankan tampilan profesional.
Cara Menilai Mitra Teknologi dari Sisi Dampak Bisnis
Mitra teknologi yang tepat tidak hanya dinilai dari spesifikasi perangkat, tetapi dari seberapa kecil dampak gangguannya ke operasional harian. Anda perlu melihat kecepatan kerja, kerapian implementasi, dan kemampuan vendor menjaga ruang tetap siap pakai selama proyek berjalan.
Kecepatan Respons dan Ketepatan Eksekusi di Lingkungan Kerja Aktif
Di kantor yang aktif, respons cepat sangat penting karena keterlambatan kecil bisa mengganggu banyak orang. Vendor yang sigap biasanya lebih mudah diajak koordinasi saat ada perubahan jadwal, kendala lapangan, atau kebutuhan penyesuaian mendadak.
MLV Teknologi, misalnya, dikenal melalui ulasan pelanggan sebagai tim yang cepat, profesional, dan mudah diajak komunikasi. Kecepatan ini sangat krusial dalam menjaga kelancaran video conference dan aktivitas bisnis lainnya.
Kerapian Implementasi sebagai Faktor Penghematan Jangka Panjang
Pemasangan yang rapi bukan soal estetika saja. Kabel yang tertata, perangkat yang mudah diakses, dan layout yang masuk akal akan memudahkan servis serta menekan risiko kerusakan fisik pada perangkat AV Anda.
Dari pengalaman lapangan, pekerjaan yang rapi hampir selalu menghasilkan biaya maintenance yang lebih rendah di tahun-tahun berikutnya. Hal ini menjadi fondasi penting bagi keberlanjutan fungsi smart office Anda.
Indikator Vendor yang Layak Dipertimbangkan Perusahaan
Saat menilai vendor untuk kebutuhan integrasi sistem dan AV, gunakan ukuran yang dekat dengan dampak bisnis berikut:
- Apakah mereka memahami alur kerja smart meeting room Anda
- Apakah instalasi bisa dilakukan tanpa mengganggu operasional harian
- Apakah solusi video wall dan kontrol pencahayaan mudah dirawat oleh tim internal
- Apakah komunikasi mereka terkait unified communications cepat dan jelas
- Apakah layanan mereka mencakup konsultasi, instalasi, dan dukungan lanjutan
Jika indikator-indikator ini terpenuhi, Anda lebih mungkin mendapatkan efisiensi operasional yang nyata, bukan sekadar perangkat baru yang mahal.


Recent Comments